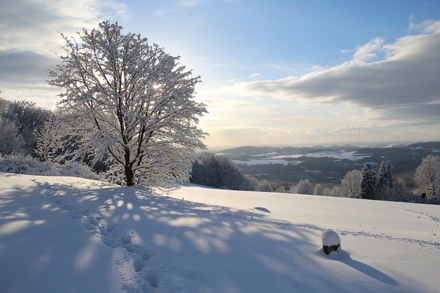
The Diversity of Seasons, Pt 4: Winter (cont)
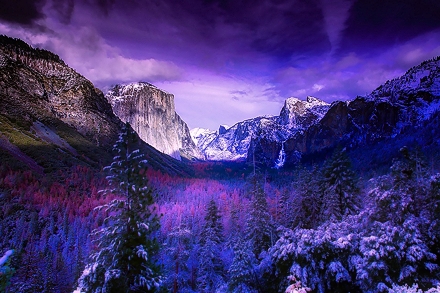
Yosemite National Park, California. Image by “12019”, courtesy Pixabay.com, and licensed under CC0.
This series is a concordance of Seasonal Summations for different locales around the world. That serves a number of different functions:
- it provides a climatic baseline from which any number of analogues, regardless of campaign genre, can be generated;
- it compares and contrasts different locations, enabling the reader (and the author) to start getting a grip on the really critical factors in terms of weather generation simulations;
- it acquaints the reader with backgrounds and histories on a heap of locations, each of which can be used as the inspiration for others if not used directly; and,
- it gives a list of the seasonal activities in each location, again providing a rich source of ideas that can be translated into any game genre.
But predominantly, it’s about the weather – and so far, it’s been all about Winter.
Part 1 began with Winter descriptions for McMurdo (Antarctica), Hobart, Melbourne, Sydney, Brisbane, Tahiti, and Cairo. It explored, completely as a side issue, the role that latitude plays in the weather.
Part 2 covered Winter in Brazil, Puerto Rico, Miami, New Orleans, and New York City. Or to put it another way, it examined the role of the Western Atlantic and – again as an aside – determined that it wasn’t the water temperature or gulf stream that mattered so much, it was the air above the water and the direction it moved in.
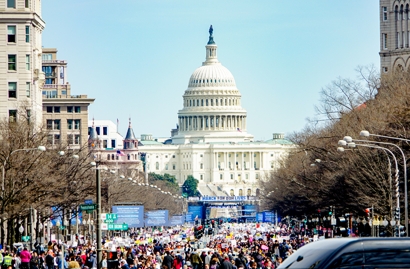
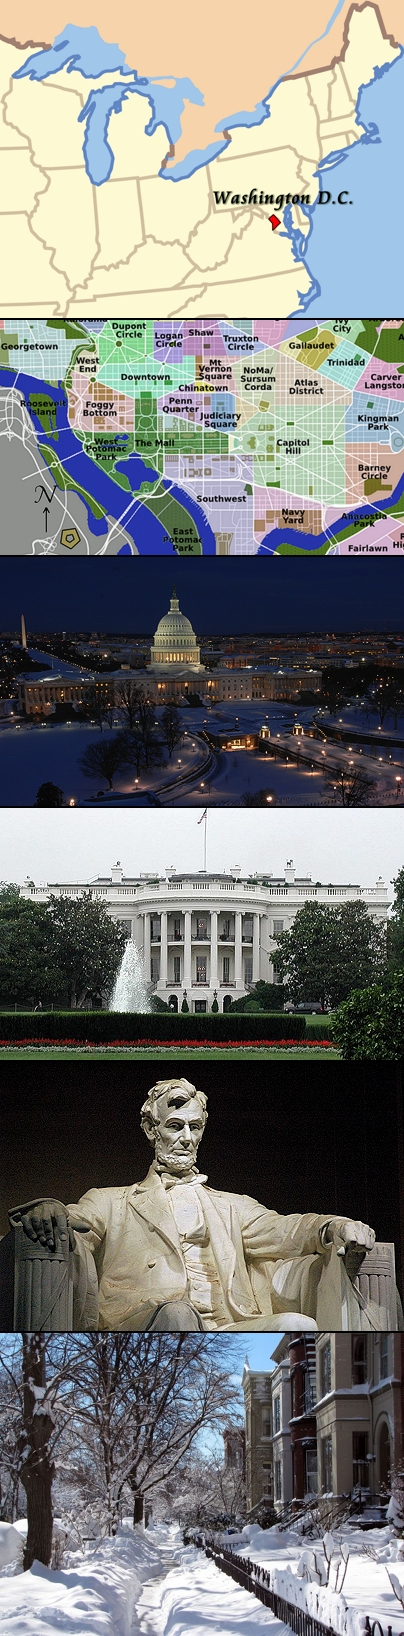
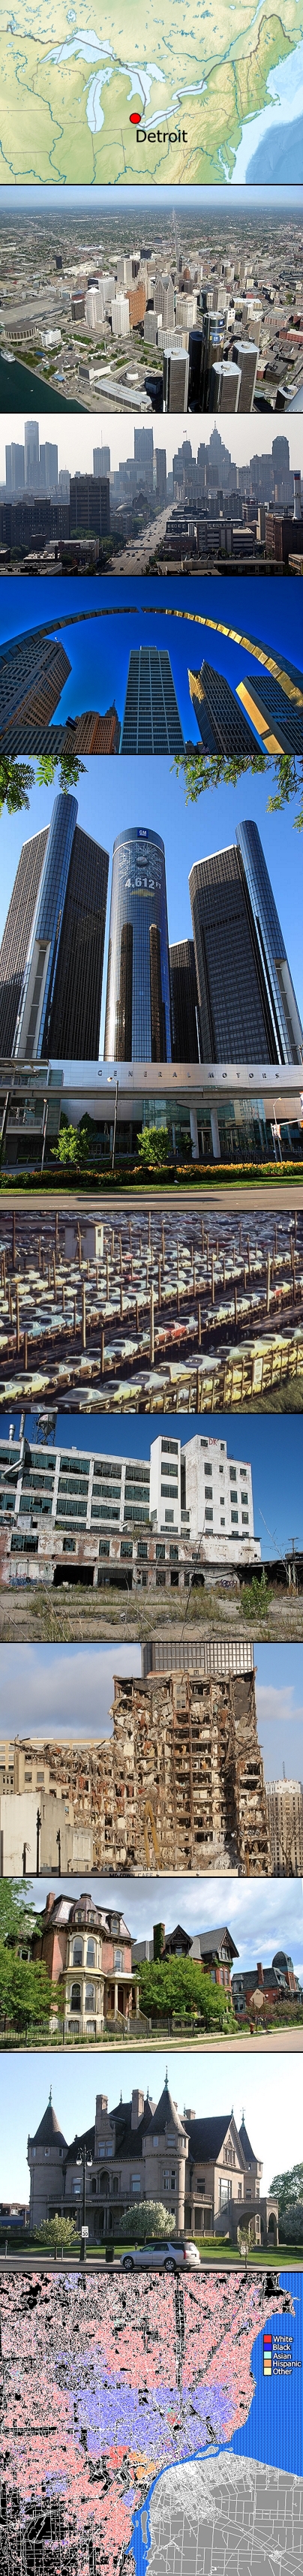
Part 3 began a trek westward across the USA, examining the relevance of longitude, and found that it was rather more important than generally thought – but only in terms of the proximity of masses of water, and the extent to which air currents can carry moisture from a water-source to land. So far, all the locations have been within 4° of latitude, but there have been some locations added to the list in Part 4. This tour started in Washington DC (following New York City in Part 2), and then traveled to Detroit, Chicago, and finally a city fairly close to midway across the US (and perhaps the most surprising one to date), Omaha, Nebraska.
This is the fourth post in the series, and the second half of that American Trek, and the focus this time is on Mountains and the Eastern Pacific. We’ll start in the deserts of Nevada for Las Vegas, then head to just east of the Rockies for Denver, Colorado. I’ll then cross them to find Spokane, Washington. My preliminary research into that location convinced me that I needed northern West-Coast representation, and (with some difficulty) chose Seattle, Washington for the purpose. That will be followed by San Francisco, wrapping up this section of the series.
Part 5 will look at the central and north-Western Pacific with a number of Asian cities chosen to be comprehensive from the many available, on the basis of everything I’ve learned so far working on this series. The current plan calls for Honolulu, Tokyo, Beijing, Bangkok, Shigatse (Tibet), and Kathmandu (Nepal). The only location missing is India, but that would be another deal like Brazil; India contains everything from Himalayas to sub-tropical or even semi-tropical Jungle, and just about anything else you can think of, in-between. A single entry would be inadequate, and anything else wouldn’t add anything you wouldn’t already get from the above. There remains a little uncertainty over Shanghai vs Beijing, and whether or not to include Hong Kong, simply because I think the weather there might be as unusual as the location.
Part 6 is going to deal with Southwestern Europe (plus a Canadian ringer): Montreal, Rome, Madrid, London, Glasgow, Berlin. The most notable omission in this section is Paris, and I’d love to sneak it in.
Part 7 wraps up Winter, dealing with Northern Europe and North-Eastern Eurasia (with an American ringer): Switzerland, Stockholm, Moscow, Siberia, Anchorage, and Reykjavik. All environments that can be characterized as Alpine, or colder.
Thereafter, parts 8-14 will handle Spring (same cities), parts 15-21, Summer, and parts 22-28, Autumn. Currently I’m averaging 13,000 words to a post, or about 2400 words to a city. My revised estimate for the whole series is 250,000 words. It’s my hope and expectation that because I don’t have to do histories etc for each city in parts 7-28, that they will be half as long and can be knocked out almost twice as fast. At the moment, it’s taking 1.7 working days, 4 days a week, per city; if I can get that down to a city a day or better for the latter parts of the series, the whole thing should be complete around December 12, fingers crossed!
But ideally, I’ll get done faster than that, as I have other plans for the last quarter of 2018! In fact, if I’m too far behind schedule when Winter is done, I’ll move on to other things and do a-season-a-year until 2021!
It’s good to have a plan….
This is a Serial Blog Post. That means that I will add to it for an hour or so four weekdays a week, and it will get finished when it’s finished. Come back regularly for an update, or comment on (and subscribe to) this post to never miss being advised of one!
PS: Another change being made from this post forward is that I’m moving this notification closer to the head of each post. Some readers weren’t noticing it. I have also made the decision to save a little formatting time by only posting updates when a city’s entry is finished as an encouragement to keep plowing on as quickly as I can. This posting, which constitutes an advisory notice of the changes, will be the only planned exception.
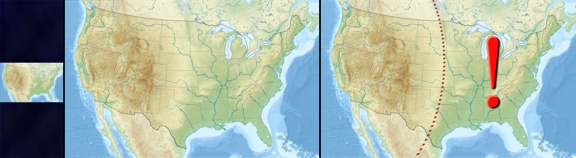
One more PS before I get started. Sometimes you can see things in a thumbnail that are really hard to spot otherwise. So it was with the source map that I’ve been using for my US Locations, presented below in three forms: Thumbnail Sized, Somewhat larger, and Somewhat larger with notation. Notice the very clear curving line that bisects the continent…
Okay, so maybe it’s old news to everyone else. But I had never noticed it before. Once you become aware of it, it’s easy to see, even in the unmarked map. I’m not even completely sure of the significance – but I thought it worth calling attention to.
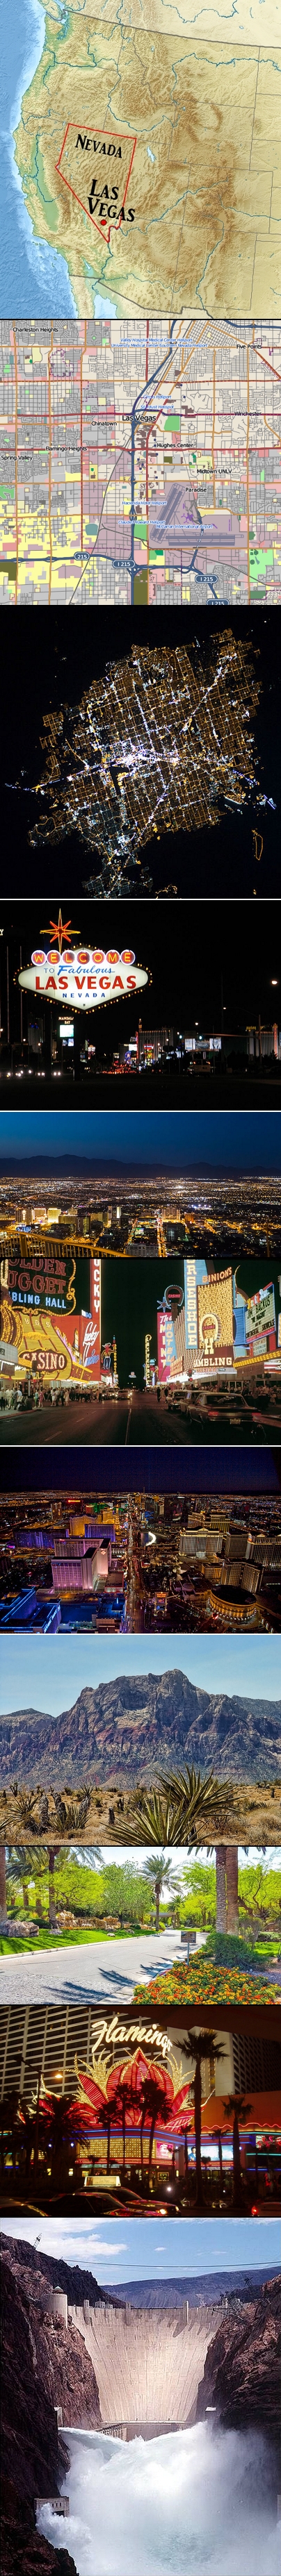
This montage contains:
- Location of Las Vegas map
- Map of Downtown Las Vegas by Dr. Blofeld (I kid you not!) CC-2.0 License, modified by Mike to increase color-contrast
- Las Vegas at night from Orbit by NASA Earth Observatory / the ISS Expedition 26 crew. North is to the right of the picture (use the map above to orient yourself). The Vegas Strip is reputed to be the brightest spot on Earth due to the concentration of lights on its hotels and casinos. The unlit desert surrounds highlight just how compact an Oasis Las Vegas is.
- Welcome to Las Vegas Sign by David Vasquez (Public Domain Image)
- Las Vegas at Night (2013) by Joao Carlos Medau from Campinas, Brazil via Flikr and Wikipedia Commons, License CC-2.0. This image shows “greater” Vegas, including the surrounding valley.
- The Las Vegas Strip in the late 1960s by “That Hartford Guy” License CC-by-SA-2.0 via Flikr via Wikipedia Commons. This picture features the Golden Nugget Casino. The view hadn’t changed too much when I visited Vegas in the 1970s. Note how the lights of the city just seem to stop at the end of the block even though the road continues!
- An aerial view of the Las Vegas Strip (2009) by Carol M Highsmith, from her photographic collection in the US Library Of Congress via Wikipedia (Public Domain image).
- Majestic Mountain in Red Rock Canyon National Conservation Area by Serge Melki of Indianapolis, USA from Flikr via Wikipedia License CC-by-SA-2.0. While the mountain is very pretty, it’s the foreground that is relevant because it looks like the natural terrain and especially the colors of Las Vegas as I remember it. The desert becomes almost gray in many photographs, giving a false impression, especially early and late in the day.
- But add plenty of water, and you get this: The entrance to MacDonald Highlands in Henderson, Nevada by Rmvisuals via Wikipedia, License CC-by-SA-4.0. (Henderson is the little protrusion of lights at the upper right of the satellite photo, and part of the Las Vegas Metropolitan Area). Note that it has the 7th-highest per-capita income in the USA.
- The Flamingo Hilton in 2006 by Steve Cadman via Flikr, usage License CC-by-SA-2.0. The Hotel and Casino appears little-changed from when my family and I stayed there in the 1970s, and it holds a special place in my family history. The parking lot is the last place my sister and I saw our luggage before it was stolen off a trolley after being unloaded from the Airport Bus. (The Hotel did their best by us, I hasten to add, and the Insurance bought us our first color TV). You never know what you’re missing until you see color for the first time!
- Hoover Dam releasing water in 1998 (public domain photograph) via Wikipedia Commons
Except where otherwise noted, all images used to illustrate this article have been sourced from Wikipedia Commons, and are used under creative commons CC3.0 or later.
17. Winter In Las Vegas
Las Vegas gives the impression of being one of the most unusual settlements in the continental US – no, make that “one of the most unusual settlements anywhere”, period. Most cities have some form of Urban Renewal program, even if it is one dictated by nothing more than economic opportunity. Equally, most cities have a historic restoration and renovation program aimed at rejuvenating and preserving the oldest, most iconic structures within the community’s boundaries. Only in Las Vegas is it deemed acceptable, even sensible, to demolish an iconic structure for which the first blush of fame is beginning to wear thin, in order to construct something even more palatial.
Should something ever happen to wipe out the human race while sparing our structures, it would not be at all unreasonable for alien archaeologists to declare Las Vegas humanity’s capital, based solely on the amazing construction of the Strip and its Casinos. And, from that misconception, a whole raft of even more inaccurate speculations would inevitably flow – “Rulers” viewed as “Gods on earth”, poker machines as devices of worship, and innumerable altars with arcane symbiology as altars, perhaps? Other places like St Petersburg and the Taj Mahal with equal but isolated splendor as the seats of Regional Rulers? Who knows?
This is not a town without history to share; it’s just that the history seems to take a remote second or even third place to the pursuit of gambling revenues.
Or does it? What’s the real story?
The History
A young Mexican scout named Rafael Rivera is credited as the first non-Native American to encounter the valley, in 1829, but it wasn’t named by Westerners until trader Antonio Armijo led a 60-man party along the Spanish Trail – a conflation of trade routes from Santa Fe, to Los Angeles, California – in 1829. The name means “The Meadows”, and it was named for abundant wild grasses and a desert spring that provided much-needed water to westward travelers.
In 1855, eleven years after John C Fremont helped popularize western migration and at the tail end of the California Gold Rush as production of the precious metal shifted from easy surface pickings to more difficult subterranean mining, members of the LDS Church built a fort in Las Vegas as the site was halfway between Salt Lake City and Los Angeles. This fort was abandoned several years afterwards, but its remains are still visible, located just north of the Downtown region of the city (which lies East of the northern end of the Strip, something I had always wanted to know).
At the start of the 20th century, the population stood at just 25. In 1905, the city was formally founded when 110 acres (45 ha) of land in what would become the Downtown area, and which were located adjacent to the Union Pacific Railroad tracks, were auctioned. Five years later, the population was 800, and by 1930, it was 5,165.
1931 was a pivotal year for what was, then, the town of Las Vegas. Nevada legalized gambling, reduced residency requirements for divorce proceedings to only six weeks, and began the construction of Hoover Dam (completed in 1935). All three had a role to play in creating modern-day Las Vegas, but especially the first and last. Hoover Dam still powers the lights of Las Vegas.
There was an immediate impact; the influx of workers helped the region avoid economic calamity during the Great Depression. In 1941, what is now known as Nellis Air Force Base, and home to the aerobatic team known as the Thunderbirds, was established. By now, the population was more than 8,000.
Following the second world war, lavishly decorated hotels and casinos, providing big-name entertainment, became synonymous with Las Vegas and the population boomed. Nuclear Weapons testing at the Nevada Test Site (105km / 65 miles northwest of what still wasn’t a city in terms of residents, but which may have been after counting temporary visitors) began in 1951 and continued until 1963.
Casinos like the Flamingo, Dunes, Stardust, and Desert Inn made huge profits that were regularly skimmed away by their Organized Crime owners. The government knew some Nevada casinos had legitimate partners fronting for unlisted owners as early as the 1940s, but the May 1957 assassination attempt on New York crime boss Frank Costello blew the lid wide open. “Costello was rushed from the crime scene with nothing more than a severe scalp wound, but inside his sleek suit pocket, the responding officers found a ledger with the previous day’s gaming totals for the Tropicana casino. Even the FBI who had previously denied there was an organized crime group or Mafia had to admit this was a serious link to Nevada’s casinos from known crime families.” – Gambling Sites.com
The Nevada Gaming Control Board, to its credit, insisted that new owners for the Tropicana – which had been open for less than a month – be found. But that didn’t stop the flow of proceeds to known crime families. This was only the beginning of a long campaign aimed at cleaning up Casino ownership in Las Vegas.
In 1959, the iconic “Welcome To Las Vegas” sign was created and located 6.4km (4 miles) south of the actual city limits, a distinction that is ignored by both locals and tourists who refer to the entire Metro Area as “Las Vegas”. A year later, 64,405 people were calling the city home.
Caesars Palace was established in 1966, and it was the beginning of the end for private owners. Designed to be an opulent glitzy experience dedicated to catering to wealthy players, the focus was more upmarket than grassroots. The inauguration party included a feast served by scantily-clad waiters and waitresses who 50,000 glasses of champagne, 300 pounds of chunk crab, 3,500 pounds of filet mignon and enough caviar to fill dozens of bathtubs. More than $42 million in advance bookings had been made for the first months of operation, clearly signaling the way forwards.
When the owners were linked to organized crime figures in New York and New England by a Federal Organized Crime Task Force in 1969, they were forced to sell; the new owners gave the casino a Corporate ownership that led the way into a less seedy business culture. This was a wave of change that had been building for three years, when Howard Hughes moved into the penthouse suite of the Desert Inn and began negotiating for its purchase in 1966. Those negotiations took just four months, and Hughes went on to purchase several other Casinos and Clubs along the Strip such as the Silver Slipper and the Landmark Casino.
A further signpost to the changing times was the opening, also in 1969, of the International Hotel (now known as Westgate Las Vegas)- with 1512 rooms, the first of the Mega-resorts. The first two performers to appear in the International’s showroom were Barbara Streisand and Elvis Presley, and the shows were sold out for 30 days straight; by the time both performers had finished these performances, the ink between Big Entertainment and the Big Casinos had been indelibly forged.
In 1973, the first MGM Grand Hotel and Casino, with 2084 rooms, was opened to become one of the largest Hotels in the world (at the time), and the standard rooms within were up to four times the size of its rivals for that crown. But this was the high-water mark for the era.
By 1970, Las Vegas may have officially become a city, but for the first time in two decades, growth had fallen below 100% a decade. Over the next decade, it continued to slow, as the Strip became increasingly dilapidated (relatively speaking). By 1980, it was down to +30.9% over the preceding decade. The reason: the economy was dependent on the gaming industry, and that industry faced new competitors, both in the form of Off-the-Strip casinos and in cities like Reno. Las Vegas retained the lions share, but the clubs were no longer the dominant force they had been in the late 60s.
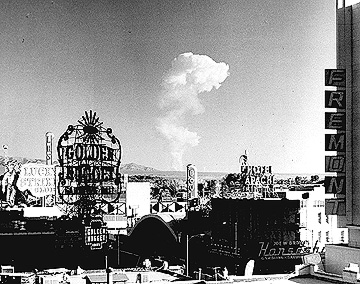
Downtown Las Vegas with a mushroom cloud in the background. Scenes such as this were typical during the 1950’s. From 1951 to 1962 the government conducted 100 atmospheric tests at the Nevada Test Site. Photograph from the National Nuclear Safety Administration, Nevada, via Wikipedia.
Casino owners began casting around for secondary income sources to revitalize the industry; the Circus Circus casino, for example, featured a video-game arcade and a big-top show. Parents found that they could leave their children in the circus area and play for hours in the Casino.
In the decade 1970-1980, existing properties were redeveloped, most notable the Golden Nugget casino in 1973-77, again targeting a wealthier clientele with the help of Frank Sinatra as headliner and promoter, and a few successful new ventures began, such as Binion’s Horseshoe Casino introducing the World Series Of Poker in 1970.
“Still, a single poker tournament couldn’t prop up all of the profits in the Downtown area, and most of the small casinos with lots of nickel slot machines and $2 blackjack like the Bird Cage, Mint, Nevada Club, and Pioneer, were closed by the end of the 1970s.
“Small clubs along Las Vegas Boulevard like the Jolly Trolley, Centerfold, and Orbit Inn also closed during the 1970s as players gravitated to larger properties that featured nearly free meals, $29 rooms and cheap dinner shows with entertainers like Johnny Carson, Don Rickles, Frank Sinatra, Sammy Davis Jr., Diana Ross, Bob Newhart, Cher and Paul Anka.” – Gamblingsites.com.
But the glamour had faded, and the mob had been ousted, and the combination of an economy struggling to cope with the changes and Reagan-era conservatism put the city’s future in limbo.
“A lot of the ‘classic’ hotels [had become] rundown shadows of their former selves. A devastating fire in 1980 at the original MGM Grand killed more than 80 people, and just a few months later a fire at the Las Vegas Hilton killed eight more. In some ways these tragedies helped to further the transformation of the public’s view of the entire city. Las Vegas became tacky, desperate, and possibly unsafe.
“Even the showrooms… had become something of a joke. For entertainers, Vegas was where you played when your career was over, not when you were on top.” – History in Las Vegas
Las Vegas was moribund and uncool as a destination for the most part of two decades. It was Golden Nugget owner Steve Wynn who found the solution, raising $630 million (mostly through the sale of Junk Bonds) and building the first of the Modern Generation of Casino-Hotels, The Mirage. It opened in 1989, “fronted by five-story waterfalls, lagoons, and lush tropical foliage – not to mention a 50-foot volcano that dramatically erupted regularly! Wynn gave world-renowned illusionists Siegfried & Roy carte blanche (and more than $30 million) to create the most spellbinding show Las Vegas had ever seen, and he brought in world-class chefs to banish the idea that all you could eat in the town were all-you-can-eat spreads and $4.99 prime rib.”
The immediate success both financially and in terms of rejuvenating the city’s image brought about a new boom. A King-Arthur-themed hotel/casino, the Excalibur, became the world’s largest (at least for a while) when it opened in 1990.
In 1993, The Circus Circus redeveloped itself to incorporate a five-acre amusement park, Grand Slam Canyon.
The same year also saw them complete the Luxor Las Vegas, a modern interpretation of what Ancient Egypt might have looked like, followed in October of 1993. A crowd of 10,000 attended the opening. The pyramid (which cost $375 million to build) was, at the time of the opening, the tallest building on the strip. It contained 2,526 rooms and a 100,000 sq ft (9,300 m2) casino. The hotel’s pyramid is similar in size to the Red Pyramid and Bent Pyramid of Egypt. When the resort opened, it featured a “Nile River Tour” – a river ride that carried guests to different parts of the pyramid, passing by pieces of ancient artwork. The casino also featured “King Tut’s Tomb and Museum”, a duplicate of King Tutankhamen’s tomb, as found in the Valley of the Kings near Luxor, Egypt, from which the complex derived its name.
Still in 1993, and in between these developments, a new MGM Grand was opened, also backed by a theme park, which ended the Excalibur’s claim to its record.
The year 1995 marked the opening of the Fremont Street Experience in Las Vegas’s downtown area. This canopied five-block area features 12.5 million LED lights and 550,000 watts of sound from dusk until midnight during shows held on the top of each hour. It also saw the Hard Rock Hotel open, a “Hard-Rock Cafe” styled Hotel-Casino.
1996 brought the French-Riviera-themed Monte Carlo and the Stratosphere Las Vegas Hotel & Casino, which features an 1149-foot tower. In 1997, the “New York – New York Hotel and Casino” lifted the bar still higher, designed to evoke with a single massive construction the 1940s skyline of the city for which it is named on an 18-acre site. The US Post Office “Forever Statue of Liberty Stamp”, which was intended to show the actual Statue of Liberty, inadvertently uses an image of the replica at the New York-New York due to an error by the stamp designers.
And then 1998-1999 blew all this construction out of the water with the completion of the Bellagio, the Mandalay Bay, the Venetian, and the Paris Casinos. Since then, the list of mega-complexes has only grown – the rebuilt Aladdin (which only lasted a couple of years before being completely redeveloped by Planet Hollywood), the Palms, the Wynn, the Palazzo, the Encore, the Aria Resort and Casino – the list goes on and on (and I’ve only taken it into 2009)! But, little by little, a new wave of maturity was taking over; the wacky, eye-catching themes were phased out (as much as one can when one’s hotel looks like a castle), and a more stable and secure generic sophistication took its place. The arenas of competition between the modern Hotel-Casinos are things like decadent nightclubs, celebrity chef-backed restaurants, fancy spas, and superstar shows.
And, in the middle of all that change, the public perception of the City was transformed, first by the original CSI (2000-2015), Las Vegas (2003-2008), reality shows like Pawn Stars (2009-present), American Restoration (a spin-off) (2010-2015, then continuing with a new cast and format), and movies such as Oceans Eleven (2001).
These days, and contrary to the impression held (and delivered) in the first few paragraphs, Las Vegas at last seems to be a city that’s entirely comfortable within its’ own “skin”.
The Demographics
The population breakdown of Las Vegas has been metamorphosing considerably since 1970. Back then, Blacks and African Americans totaled 11.2% of the population, Hispanics/Latinos, 4.6%, and Asians 0.7%; 87.6% of the population was White. In 2010, the Black figure was virtually the same (after a dip in 2000), the Hispanic figure was up to 31.5% (almost one in three), and Asians formed a significant minority at 5%. All this has come at the expense of the White representation, which is now only 62.1%. It follows that recruitment of the non-white demographic during the most recent expansions has been disproportionate.
In some ways, that’s not a huge surprise. The Moulin Rouge Hotel which opened in May, 1955, broke new ground as the first integrated hotel/casino within the US. For a while, it was even owned by the first African American woman to hold a Nevada Gaming License, and many of those who enjoyed and were employed by the hotel became activists and supporters of the cause. In 1960, under threat of a protest march against racial discrimination in the Las Vegas casinos down the Strip, a meeting was hurriedly arranged by the Governor between hotel owners, city and state officials, local black leaders, and then-NAACP president Dr James McMillan. The meeting was held on March 26 at the closed Moulin Rouge, and resulted in an agreement to desegregate all Strip Casinos.
The Hotel was closed in November 1955 and by December, it had declared bankruptcy. It has been partially demolished after a series of fire.
So there has been a relatively long history of integration within the city. When it declined, it would have become attractive as a relatively low-cost community, and when the resurgence occurred, the locals would have been first in line to take advantage of the resulting employment opportunities.
The Weather
Las Vegas is located in a basin of the Mojave Desert, surrounded by mountain ranges on all sides of more than 3000m (10,000 feet) elevation; much of the landscape is rocky and arid. Flash floods are possible, but have become less frequent and less damaging through improved drainage systems.
The climate is typical of the Mojave, but is slightly cooler in Winter thanks to the 2000-3000 feet of elevation. Officially a subtropical hot desert, it is characterized – according to climatologists – by long, very hot summers; warm transitional seasons; and short, mild to chilly winters. Las Vegas is among the sunniest, driest, and least humid locations in North America, with exceptionally low dew points and humidity that sometimes remains below 10%.
Las Vegas winters are short and generally very mild, with chilly (but rarely cold) daytime temperatures. Like all seasons, sunshine is abundant. Winter evenings are defined by clear skies and swift drops in temperature after sunset, with overnight lows sinking to 3.9°C (39°F) or less in most December and January nights. December is the year’s coolest month.
As with many other locations, the detail paints a slightly different picture. If Winter is defined as record highs below 100°F, it’s November to April (6 months). If it’s record highs below 90°F, November to February becomes winter, and we have a spring but no autumn. If it’s record highs below 80°F, we get the official 2-month December-January Winter.
It’s a similar story with the average of the highest temperatures recorded for the month, only the numbers are different:
<95°F: 7 months (October-April);
<80°F: 4 months (November-February);
<75°F: 3 months (December-February);
<70°F: 2 months (the official December-January winter).
The average daily highs across each month confuse the picture even more, suggesting a 2-month summer, 3-month autumn, 2-month winter, and 5-month spring.
I get exactly the same range of results when I study the average monthly lows, the mean minimum temperatures within each month, and even the record lows. It’s just as valid to say that Winter starts in October and runs through April as it is to say otherwise.
The notion of there being four seasons is a human creation based upon observations of a limited group of climates, and because they are used to trigger human behavior (“the planting season”, etc), we have been shoehorning the actual weather into that pattern as best we can, ever since. The definition of “winter”, in other words, depends on just where we draw the line between wintry conditions and non-wintry conditions. Sometimes, that line is clear, and sometimes it is not. Las Vegas is an example of the latter.
So I am going to go with the pattern that best fits the data that I can see, even though it contradicts the official description. Las Vegas has four seasons, starting in December: Not-Hot, Uncomfortable, Hot, and Less Unpleasant:
- Not-Hot: December-February
- Uncomfortable: March-April
- Hot: May-September
- Less Unpleasant: October-November.
The differences between one season and the next are merely a matter of degree; you only get substantial differentiation across the two most extreme seasons.
This, then, is the weather for the season I have defined as Not-Hot. To avoid confusion with any descriptive terminology that may be used, the “season” name will always be given in italics and “inverted commas”.
The record highs are fairly mild except at the end of the season, as the season drifts into “Uncomfortable”: Dec: 26°C (78°F), Jan: 25°C (77°F), and Feb: 31°C (87°F). It is worth noting that the February value is the same as the November, but that is not the case with the other values quoted below.
The usual daily maximum is more comfortable, even perhaps cool-to-pleasant: 13.7°C (56.6°F), 14.4°C (58°F), and 16.9°C (62.5°F) respectively.
Some days are hotter; at least once during each month, you can expect maximums of 19.4°C (66.9°F), 20.1°C (68.2°F), and 23.6°C (74.5°F), respectively, to be reached, and of course, some years are even hotter.
Of course, we’re talking about a desert environment, and everyone knows the nights are cool-to-cold in a desert. The usual daily minimums by month are 3.7°C (38.7°F), 4.1°C (39.4°F), and 6.3°C (43.4°F). Some nights each year are even colder; at least once in the month, you can expect a minimum of -2.9°C (26.8°F), -2.2°C (28°F), and -0.8°C (30.6°F), respectively, to be forecast. These are the ONLY three months of the year with such values below freezing point, and this is one of the unifying values around which the “not-hot” season has been defined.
Of course, some years produce extremes beyond these norms. The record lows are below zero from October through April, and in single digits centigrade in three more months. In “Not-Hot”, the records are -12°C (11°F), -13°C (8°F), and -9°C (16°F), respectively. Again, it’s worth noting that the record minimum for November is marginally cooler than that of February.
But don’t be fooled by these numbers. Freezing temperatures are recorded on an average of 16 nights each “Not-Hot”, but it is exceptionally rare for temperatures to fall to or below -4°C (25°F), or to remain below 7°C (45°F) for an entire day.
Rainfall is scarce, with an average of 4.2 in (110 mm) dispersed between roughly 26 to 27 total rainy days per year. Most of the annual falls occur during the “Not-Hot” months, but even the wettest month of the year (February) averages only four days of measurable rain.
The average number of “rainy” days is 3 in December, 3.1 in January, and 4 (as mentioned) in February. It’s worth noting that the figure for March is 2.9, only statistically different to that of December or January. In essence, one-in-ten, repeat, rising to one-in-seven, then falling back to one-in-ten. The rest of the year has notable fewer such days in a month save a “mini-wet” season in July-August.
The amounts that fall on these rare rainy days are small. The averages are 12.7mm (0.50”), 13.7mm (0.54”), and 19.3mm (0.76”), respectively. Dividing those by three (four in February) gives the true scale of the wet weather of 4-point-low-something to a-little-under-5 mm – which is a “light shower” in Sydney, the sort of event that does nothing to cool temperatures and only raises the relative humidity, leaving the day less comfortable after they pass than it was before.
Snow is even rarer. The mountains immediately surrounding the Las Vegas Valley accumulate snow every winter, but significant or sustained accumulation within the city is rare; the last time it occurred was on December 16, 2008, when the city received 9.1cm (3.6”).
Las Vegas records an average of 310 sunny days a year and bright sunshine during 86% of all daylight hours. December is the cloudiest month of the year, but that isn’t saying much since the average is still 78% of the possible sunshine. January isn’t much different at 79%, and February is 81%. It’s worth noting once more that November scores 80%. Every other month of the year records 85% or more.
When I started writing this, I expected the desert climate of Las Vegas to be simple and straightforward – so much so that I almost culled this city from the series. What I didn’t expect was a climate so complicated that it would challenge the very definition of the seasons.
I must also place a caveat to conclude this subsection: any analysis is only as robust as its data, and the climate data for Las Vegas available to me starts in 1961 and stops in 1990. Why the records don’t continue, I have no idea; clearly, we should now be approaching double the 29-year recorded baseline, which is to say, double the reliability of the statistics. But the numbers are what they are.
Attractions & Events Around Town
You might think that the city has no events beyond those mounted by the hotel-casinos, but that ignores the fact that people live here, the husbands and wives and children of those supported directly or indirectly by the star attractions, and they need to be kept happy, too.
December brings a number of season events, where “seasonal” can be sometimes defined as “taking advantage of the weather” instead of simply referring to the time of year.
- Beginning in late November and running through to early January is the Ethel M Chocolate ‘Light The Night’ Spectacular, in which The Mars chocolatier family hang thousands of lights on their desert plant’s garden and host special tours of their facility.
- The 26-mile Las Vegas Marathon takes place in the first week of December. Thousands participate in the all-day charity event which is full of parties and banquets for non-participants before, during, and after.
- Towards the middle of the month, Rodeo competitors gather from all over the world for the National Finals Rodeo, which lasts
a weeknine daysten days (it grew with every site I consulted). - New Year’s Eve is always going to be over-the-top in a place like Vegas. At this time of year, the strip is packed with partying street crowds and top-draw entertainers seemingly on every street corner (and in-between as well).
- A more ‘organized’ alternative to the free-for-all along the Las Vegas strip is the Downtown event at the Fremont Street Arcade which features live bands and a synchronized fireworks display. Some people start here, drift onto the strip, and then drift back for the end-of-year countdown. Between both sets of events, an estimated 320,000 attendees partied at the start of 2018.
January is relatively quiet here as it is in many US cities.
- NCAA College Basketball starts in January and runs all the way through most of June.
- There is an annual parade on Martin Luther King Jr. Day, featuring floats, marching bands, and an awards ceremony to recognize those who have contributed to the dream of equality.
- The International Consumer Electronics Show grows in size every year (10% in 2017) and regularly tops 100,000 attendees (140,000 most recently, and organizers learned after the event of another 40,000 who attempted to participate but were discouraged by the Visa process; expect streamlined processes to be in place for 2019). Much of the boost is coming from international attendance, and that is fueling increased interest in international participation.
Things liven up in February.
- A number of events in February celebrate the African-American influence on the culture and entertainment of Las Vegas, notably the kickoff breakfast at Fitzgerald’s Hotel and Casino, the largest Black-owned hotel and casino in the United States, and the family cultural event held towards the end of February at Neonopolis. Collectively, these are known as “Black History Month”.
- The Super Bowl celebration (First Sunday in February, but it used to be mid-to-late January) at the Showboat Casino Hotel is famous for attracting the High Rollers and a crowd to watch the action on several wide-screen TVs plus a lavish free buffet.
- Early February marks the Chinese New Year, which is celebrated with events all over the city (and is an excuse for themed events at many of the big Hotel Casinos, to boot). The opportunity is also taken to celebrate Japanese, Tahitian, and Thai culture.
- The Tennis Channel Open, held through February and into March, takes place at the Darling Memorial Tennis Center. Although not as prestigious as the major tournaments, the guaranteed television coverage makes this an event growing in sponsor interest, and that pulls in the players, who in turn pull in the crowds.
- Sometime between mid-February and early March, the High Rollers Scooter Weekend celebrates Mod Rockers and the iconic Scooter associated with the movement in various Vegas locations. Because, like, they can.
These events only scratch the surface. Eventbrite lists an incredible 727 annual events in and around Las Vegas. That’s an average of more than one a day, each and every day of the week – and too many for me to process for this article, so I’ve simply linked to their 49-page list!
Primary Sources:
- Wikipedia’s Las Vegas page;
- Why did the California Gold Rush end after only several years? from Reddit AskHistorians;
- Las Vegas of the ’60s and ’70s by Gambling Sites .com;
- History in Las Vegas from Frommers.com;
- Greater Las Vegas Annual Events from the EventGuide network;
- Las Vegas events calendar from TimeOut;
- Eight Vegas events that draw massive crowds by Delen Goldberg for the Las Vegas Sun.
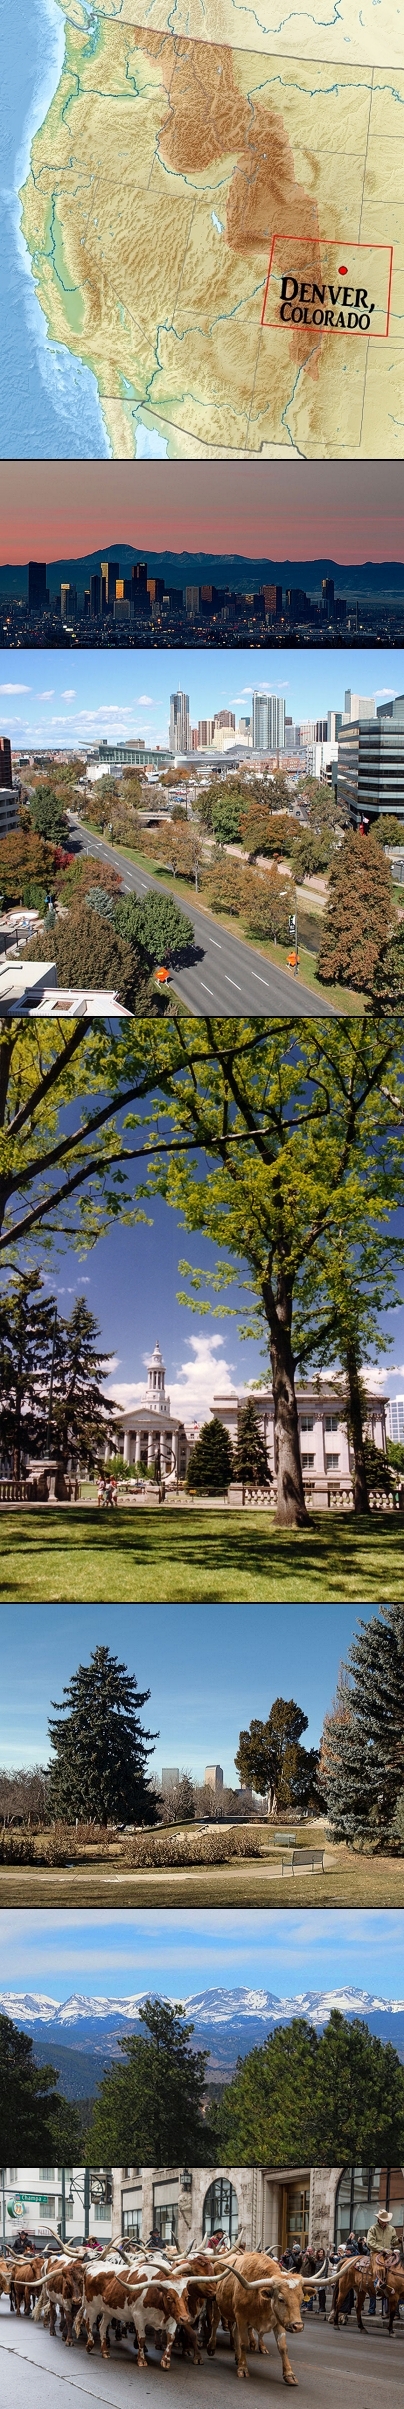
Montage Contents & Credits:
- Denver Location Map, with emphasis on the Rocky Mountains (NB: the ’emphasis’ is from a much lower-resolution map and may not be completely accurate);
- Sunrise over downtown Denver by Robert Cash;
- Speer Boulevard in Denver, 2009 by Jeffrey Beall;
- Denver Colorado in December 2008 by Roman Eugeniusz;
- Cheesman Park in the winter by David Shankbone (this used to be a cemetery);
- Continental Divide by Hogs555 – the view from just west of Denver;
- Longhorn Cattle On Parade, a public domain image from the Gates Frontiers Fund Colorado Collection within the Carol M. Highsmith Archive, Library of Congress, Prints and Photographs Division, via Flikr.
18. Winter In Denver, Colorado
Colorado contains some of the most scenic views to be found in the continental US. Unfortunately, relatively few of them are actually in Denver.
The Geography of the region is important: lots of open plains to the east, hills to the north and south, and the Rocky Mountains to the west. Latitude is some distance north of Las Vegas, which – if I were bound by a strict east-to-west progression – would normally require Denver to have appeared first on this list.
Fortunately, I’m free to vary the sequence to whatever makes the climates of the regions concerned most understandable and enlightening. Vegas was all about the desert; Denver (and Spokane, to follow) are all about the influence of the Rocky Mountains.
Denver is located in the South Platte River Valley, on the edge of the High Plains, with the foothills of the Front Range of the Rocky Mountains just 19km (12 miles) to the west.
The city is nicknamed the Mile High City because of its official elevation – exactly one mile (5280 feet / 1609.3 meters) above sea level at the benchmark location on the steps of the State Capital Building (the city has actual elevations of 5,130 to 5,690 feet, and some official websites use a different benchmark to list the elevation as 5278 feet).
In 2016, it was named the best place to live in the United States by US. News & World Report.
Since the 2010 United States Census, it has also been one of the fastest-growing major cities in the United States, with a growth rate of 15.48% over the preceding decade. The 10-county Denver-Aurora-Lakewood, CO Metropolitan Statistical Area had an estimated 2016 population of 2,853,077 residents.
The shape of the city is somewhat unusual: A slightly-irregular rectangular block, connected to another one off to the North-east and connected by a complicated northeast-southwest corridor:
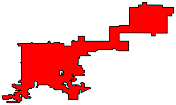
This makes more sense when you realize that the urban area extends well beyond the city of Denver, mostly to the North, South, and East.
When I examined the various photos shown on the Wikipedia page dedicated to the city, the content reminded me a lot of Sydney. The only thing separating the two cities is that Sydney is on the coast, with sea from SSW to NNE, while Denver is land-locked on all sides.
It’s not just terrain (both cities have mountain ranges to the west) that is similar and not just altitude that is different (Sydney is more-or-less at Sea Level). The lifestyle, culture, and devotion to sports are all reminiscent of Sydney. In fact, everything from the trains to much of the architecture is strangely reminiscent of the Australian city while still being just a little different.
As of 2006, Denver had over 200 parks, from small mini-parks all over the city to the giant 314 acres (127 ha) City Park – more than 1.25 square kilometers, almost have a square mile. Starting in 1911, Denver began acquiring land for mountain parks, and now have approximately 14,000 acres (57 km2) of mountain parks under management. Denver also has 29 recreation centers providing places and programming for the recreation of residents and visitors.
In 1970, Denver was selected to host the 1976 Winter Olympics to coincide with Colorado’s centennial celebration, but in November 1972, Colorado voters struck down ballot initiatives allocating public funds to pay for the high costs of the games, which were subsequently moved to Innsbruck, Austria. The notoriety of becoming the only city ever to decline to host an Olympiad after being selected has made subsequent bids difficult. The opposition was based largely on environmental issues and was led by State Representative Richard Lamm, who was subsequently elected to three terms (1975-87) as Colorado governor.
Denver has also been known historically as the Queen City of the Plains and the Queen City of the West, because of its important role in the agricultural industry of the region.
The City and County of Denver has defined 78 official neighborhoods that are used for planning and administration. These “neighborhoods” should not be confused with cities or suburbs, which may be separate entities within the metro area.
“The character of the neighborhoods varies significantly from one to another and includes everything from large skyscrapers to houses from the late 19th century to modern, suburban-style developments. Generally, the neighborhoods closest to the city center are denser, older and contain more brick building material. Many neighborhoods away from the city center were developed after World War II, and are built with more modern materials and style. Some of the neighborhoods even farther from the city center, or recently redeveloped parcels anywhere in the city, have either very suburban characteristics or are new urbanist developments that attempt to recreate the feel of older neighborhoods. Most neighborhoods contain parks or other features that are the focal point of the neighborhood.” – Wikipedia
Demographics
The minority populations of Denver have risen sharply since the 1940s. Black residents (as of 2010) account for 10.2% of the population (down from a peak in 1990 of 12.8%), Asians and Asian Americans 3.4% (up from 0.2% in 1940), and Hispanic/Latino residents have gone from 0 to 31.8% of the population. White residents have gone from 97.3% to 68.9%, and that includes 16.7% who are White Hispanics, which the earlier 31.8% does not. If these two groups are conflated, the total is more than 50% of the population.
Overall there were 102.1 males for every 100 females, but in 2015 for the category of never-married ages 25 to 34, there were 121.4 males for every 100 females – a skewed gender representation that have caused some to nickname the city “Menver”.
Climate
Denver is officially the owner of a semi-arid continental climate. But the climatic environment is a very complex one, as the climate-type map of Colorado below shows.
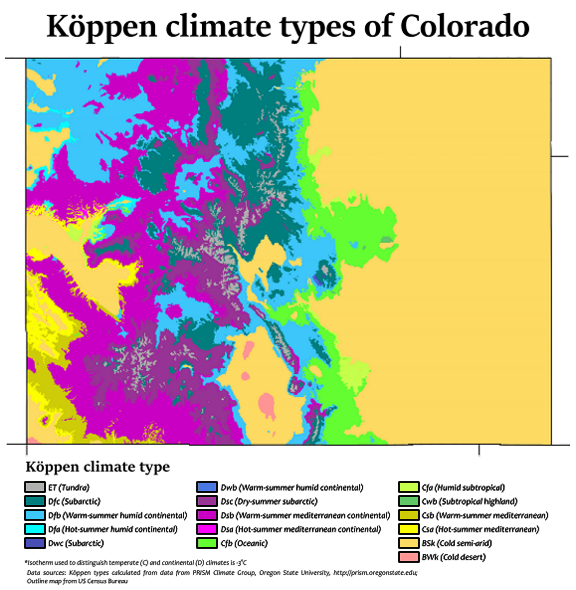
Map of the Climates within the state of Colorado by Adam Peterson, License CC-BY-4.0. Denver is located about 1/3 of the way down the state and slightly East of the state’s midpoint, in the region shown on the map as “Cold semi-arid” and just North of the protruding “Oceanic” section. You can view a much larger version (1260×1305) on Wikipedia Commons at this web address.
According to the Colorado Climate Center of Colorado State University,
“The climate of local areas is profoundly affected by differences in elevation, and to a lesser degree, by the orientation of mountain ranges and valleys with respect to general air movements. Wide variations occur within short distances. The difference (35°F) in annual mean temperature between Pikes Peak and Las Animas, 90 miles to the southeast, is about the same as that between southern Florida and Iceland. The annual snowfall at Wolf Creek Pass (elevation 10,850 feet) in the southern mountains is averages nearly 400 inches and sometimes exceeds 600 inches while at Manassa in the San Luis Valley just east of Wolf Creek Pass annual snowfall is barely 40 inches. Statewide average annual precipitation is 17 inches but ranges from only 7 inches in the middle of the San Luis Valley in south central Colorado to over 60 inches in a few mountain locations.”
Wikipedia states that Denver has four distinct seasons, a finding that is backed up by the meteorological record. “It receives a modest amount of precipitation spread throughout the year,” the site adds, and this is the key to defining the seasons.
Temperature records define Summer as June to August, and Winter as potentially September to May. However, the rainfall record defines a two-month Autumn (September-October) and three-month Spring (March, April, and May). By the process of elimination, that restricts winter to the four months from November to February. However, the temperature profile of November matches that of March so closely that it has to be considered part of the transitional season, so that we end up with a year of three equal-length seasons.
But it’s worth noting that weather that other locations would call “Winter” begin months prior to and follow for months after, this season. March, for example, has the heaviest snowfalls of the year – even though this analysis doesn’t even consider it Winter!
Due to its inland location on the High Plains, at the foot of the Rocky Mountains, Denver is subject to sudden changes in weather, and the diurnal temperature variation (the difference between day and nighttime temperatures) is unusually large throughout the year. Based on 30-year averages for December, January, and February, the Weather Channel in 2014 ranked Denver as the 18th coldest major US City.
There is a popular perception that Denver enjoys 300 days of sunshine a year (putting that “modest” rainfall into perspective), but this is somewhat inaccurate. Denver officially has an average of 115 clear days, 130 partly cloudy days, and 120 cloudy days each year.
Winters consist of periods of snow and very low temperatures alternating with periods of warmer weather due to the warming effect of the Chinook winds from the west, which have been observed in other locations to raise the winter temperature (often from below -20°C (-4°F) to as high as 10-20°C (50-68°F) for a few hours before temperatures plummet back to their base levels. [Loma, Montana, holds the record – from -48 to +9°C (-54 to +49°F), while Spearfish, South Dakota (in the Black Hills) holds the record for the world’s fastest recorded rise in temperature. Wikipedia describe the story very clearly (emphasis mine):
“On 22 January 1943, at about 7:30 AM MST, the temperature … was -4°F (-20°C). The Chinook kicked in, and two minutes later, the temperature was 45°F (7°C). The 49°F (27°C) rise set a world record, yet to be exceeded. By 9:00 AM, the temperature had risen to 54°F (12°C). Suddenly, the Chinook died down and the temperature tumbled back to -4°F (-20 °C). The 58°F (32°C) drop took only 27 minutes.”
That’s a brutal two-and-a-half-hour roller-coaster ride. Clearly, you can’t understand the weather of Denver without at least some understanding of the phenomenon. Fortunately, one diagram tells you almost everything you need to know for these purposes – the one below:

Adiabatic warming of downward moving air produces the warm Chinook wind, by the FAA of the USA, source document AC 00-61, Chapter 6, Figure 41, sourced from Wikipedia and enlarged and sharpened by Mike. You can read more about Chinook Winds by clicking on the link provided.
Snow is, at first, driven as flurries by the wind and then becomes “moist and heavy” and in an incredibly short time may disappear entirely. They can occur at any time of day or night. Without the Chinook, it is believed by the US Dept of Agriculture that without them, the livestock ranges of Montana, Wyoming, and the Dakotas would have to be abandoned in the winter as the stock would not be able to secure sufficient nourishment, and would freeze to death too often for the herds to be viable. A report held by the Departments National Agricultural Library and available online as a PDF states,
“Aside from its temperature, the Chinook bears an important relation to the amount of snow remaining on the ground in the mountains and on the plains at the time of the spring thaws. If the Chinook has been absent, or infrequent in occurrence, the accumulated snow, especially on the plains, is likely to be great. The conditions are then ripe for high spring floods. If frequent visitations of the Chinook have occurred, much of the snow on the plains will have either disappeared through evaporation or been converted into a hardened mass of snow and ice. As ice it remains a long time unmelted in the ravines and affords an abundant supply of water for the creeks and rivers during the succeeding spring and early summer. In either event the danger from floods from this source is practically eliminated. It might appear at first thought that these hot winds, which so suddenly denude the plains of snow, would themselves cause floods. Such is not generally the case. These winds are intensely dry, having lost their moisture on the other side of the Divide. Accordingly, they reach the eastern slope bereft of their original dampness, but possessing a manifold capacity for absorbing moisture from any source available. The melting snow supplies this source, and so rapidly does the evaporation follow that floods caused by the Chinook alone are practically unknown.”
How strongly is Denver affected? Daytime highs at this time of year can exceed 16°C (60°F) but also often fall to 0°C (32°F) during periods of cold weather, and can even fail to rise above -18°C (0°F) on occasion. On the coldest nights, lows can easily fall to -23°C (-10°F) or less.
The usual peak daytime temperatures in Winter are Dec 6°C (42.8°F), Jan 6.7°C (44°F), and Feb 7.9°C (46.2°F). In November and March, these climb to 11-12°C (52-54°F), noticeably warmer. However, temperatures will regularly exceed Dec 18.3°C (64.9°F), Jan 18.2°C (64.7°F), and Feb 19.2°C (66.5°F) in the course of the season, and the record highs are Dec 26°C (79°F), Jan 24°C (76°F), and Feb 27°C (80°F) – t-shirt weather, which you wouldn’t expect to last very long!
But these values are inherently contaminated by the Chinook phenomenon. The extent of that contamination will vary; it would be 100% in terms of the record highs, and a small percentage in terms of the “usual” temperatures depending on the frequency these winds are experienced.
Unfortunately, that seems to be a value that’s hard to get data on; the University Of Colorado website that I’ve quoted already simply states that they occur “Occasionally”. Digging into the causes, it seems you need a high-pressure system and a low-pressure system to be, respectively, in just the right places in order to create one. Alberta, Canada, experiences them on one day in three, but only one-third of those are sufficient to have full effect, but it is known from other sources that they decrease in frequency as you head south. A report by the USGS finally provides some specificity; Approximately 29.75% of the time the wind is from somewhere in the range the NNW to SW; 17% of the time, it comes from the SSW. That’s slightly better than one in three, and it suggests that the Alberta numbers are applicable.
So Chinooks of noticeable impact can be presumed to occur once every week and a half, on average, or about three times a month, plus the occasional extra. So the percentage of days on which Chinooks occur and contaminate the readings would be about 12%.
Which means that the usual temperatures are usually about 12% of the 16°C (28°F) cooler than indicated above – that’s -2°C (-3.4°F).
In terms of the average highest temperature of the month – which I describe as “regularly exceed” – these would almost certainly be Chinook occurrences, and provide an indication as to the usual degree of impact that they have (while the records show how big an impact they can have.
The minimum temperatures tell quite a different story. The usual minimum, according to the records, is Dec -8.3°C (17.1°F), Jan -8.1°C (17.4°F), and Feb -7.3°C (18.9°F), however the same “Chinook correction” needs to be applied [-2°C (-3.4°F)].
Some nights, the temperature can fall to Dec -20.3°C (-4.5°F), Jan -19°C (-3°F), and Feb -18.5°C (-1.3°F), respectively. These would obviously be values free from the Chinook effect, as would the record lows: Dec -32°C (-25°F), Jan -34°C (-29°F), and Feb -32°C (-25°F), respectively. It is worth noting that both November and March average below-freezing temperatures, and the record lows for only two months of the year (at the height of summer) are above freezing.
Rainfall. Just how “modest” is it, with that recurring term “arid” in the climatic description? In December, the average from 4.1 rainy days is 8.9mm (0.35”); in January, 4.1 rainy days yielding 10.4mm (0.41”), and in February, 5.3 rainy days produces 9.4mm (0.37”) – but taking the shortness of the month into account raises those numbers to 5.7 days, 10.1mm, and 0.4”, enough to state that February is not noticeably drier than January. All other months of the year (3 exceptions) average more than an inch of rain in the month, and of those exceptions, two get close to an inch and the last – November – receives 0.61”, almost double that of the following month.
The average fall per rainy day is noteworthy – somewhere around the 2.5mm mark – which is not very heavy. My part of Sydney is reasonably typical of the city, and averages 81.33mm a month over the equivalent season. That’s more than three inches – which exceeds Denver’s fall in even it’s wettest month.
The reason, of course, is that the atmospheric humidity is locked up in the form of snow.
The Colorado Climate Center describes the counterbalance to the Chinook, the arctic air masses descending from the North, as follows:
“Storms moving from the north usually carry little moisture. The frequency of such storms increases during the fall and winter months, and decreases rapidly in the spring. The accompanying outbreaks of polar air are responsible for the sudden drops in temperature often experienced in the plains sections of the State. Occasionally these outbreaks are attended by strong northerly winds which come in contact with moist air from the south; the interaction of these air masses can cause a heavy fall of snow and the most severe of all weather conditions of the high plains, the blizzard.”
Were it not for the Gulf of Mexico, in other words, the Midwestern US would be as dry and arid as central Australia.
Snowfall is common throughout the late fall, winter and early spring, averaging 53.5 inches (136 cm) for 1981-2010. The typical season for snowfall is October 17 to April 27, though snow has been recorded as early as Sept 4 and as late as June 3rd.
I have already mentioned that the heaviest falls of the year occur, according to the records, in March, even though this is outside “Winter”. Suddenly, this makes sense; it is then that the confluence of cold temperatures and southern moist air combine most intensely.
There are just short of 5 snowy days in November (one in six), and just short of 6 (one in 5) in March (and just over 4 in April, for that matter, about 1 in 7 if the “April 27″ date is considered the end of the month for the purpose. These produce, respectively, Nov 22.1cm (8.7”), Mar 27.2cm (10.7”), and Apr 17.3cm (6.8”) of snow. Use these values as comparisons.
December has slightly more snowy days than November (5.3, still about one in six), and usually receives 21.6cm (8.5”), so snowfalls are slightly lighter in the Christmas month. January brings a decline in both: five snowy days (still about 1 in six) and 17.8cm (7.0”). If you do the math, you find that the average fall is again lighter – about 1.2” vs 1.6”. February has 5.3 snowy days (but, since the month is shorter, that’s about 1.06 days in 5), producing 14.5cm (5.7”) – so falls grow more frequent but lighter as the month draws to a close.
Relative Humidity is moderately high all year round, but is highest in late Autumn, throughout Winter, and in early Spring. With the exception of March and April, this period averages better than 55% (and a high in December of 56.6%), so there is very little variation.
Late Autumn and Early Winter is the cloudiest time of year. November receives only 65% of the possible sunshine, and December 67%. In January and February, these numbers are 72% and 70%, respectively. Interestingly, there is only a slight drop in March, which I will analyze in the Spring section of the series when I get to it.
Snow is not the only Winter phenomenon of concern. Wikipedia reports that in a study looking at hail events in areas with a population of at least 50,000, Denver was found to be ranked 10th most prone to hail storms in the continental United States. In fact, Denver has received three of the top 10 costliest hailstorms in United States history which occurred on July 11, 1990; July 20, 2009; and May 8, 2017 respectively.
Tornadoes are rare but one struck 4.4 miles south of downtown Denver on June 15, 1988. The suburbs to the east of Denver and the city’s northeastern extension can see a few tornadoes (usually of the weaker Landspout variety, of which I had never heard before) each spring and summer, especially during June.
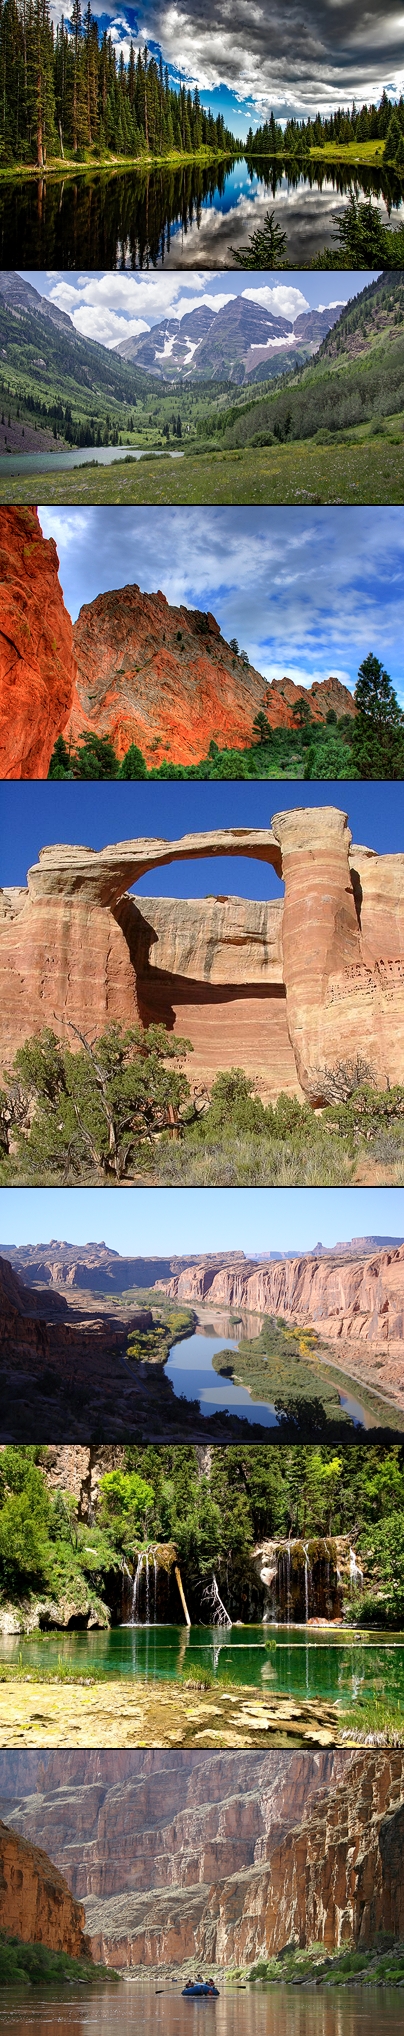
Colorado Montage contents & Credits:
- Lake Irene Reflections (Colorado), image via MaxPixel, License CC0, Link Referral Required;
- The Maroon Bells (Aspen, Colorado) by Rhododendrites;
- High rock formations at the Garden of the Gods (Colorado Springs, Colorado) image via Good Free Photos License CC0-Public Domain;
- The East Rim Arch in Rattlesnake Canyon by Pretzelpaws at the English Language Wikipedia;
- Colorado River from Moab Rim by the US Geological Survey via Flikr (Public Domain Image);
- Hanging Lake In Colorado by Stephanie McCreary (more and larger available (not free) from the link, image via PublicDomainPictures.net license CC0 Public Domain;
- Grand Canyon National Park Colorado River Boating by Mark Lellouch, image via Flikr License CC0-BY-2.0 Attribution 2.0 Generic.
Winter Activities
Because of its proximity to the mountains and generally sunny weather, Denver has gained a reputation as being a very active, outdoor-oriented city. Many Denver residents spend the weekends in the mountains; skiing in the winter and hiking, climbing, kayaking, and camping in the summer.
This proximity is both its blessing and its curse; most visitors barely “scratch the surface before disappearing to Aspen, Vail, or Breckenridge”. In an attempt to capture some of the tourist dollars literally fleeing their city, Denver is especially active at creating and promoting events all year around, which would make it a fun place to live.
You don’t have to look into the subject very hard before discovering that hosting a winter Olympics, and how to pay for it, remain extremely important questions to Denverites. Expect the question to be a perennial subject of conversation at this time of year.
Because of the location, I am going to completely ignore the obvious; there will be ice skating rinks, and mountain ski resorts are only an hour, or less, away. Otherwise, this list would be extraordinarily lengthy and full of redundancies.
It’s also worth noting that some may consider both March and April to be Winter, and certainly, winter activities are possible into mid-spring that simply can’t happen elsewhere.
Denver and the surrounding cities are home to a large number of local and national breweries, and hosts many nationally-recognized museums. At the time of writing, these were hosting no less than nine special exhibitions – eleven, if you count “A Passion for the Contemporary Art of Ballet” (3-dimensional wall art created directly from posed Colorado Ballet Dancers, available for public viewing one night only) and “Ai Weiwei: Circle of Animals/Zodiac Heads” (a reinterpretation of the twelve bronze animal heads representing the traditional Chinese zodiac that once adorned the famed fountain-clock of the Yuanming Yuan, an imperial retreat in Beijing). Many of these museums have free days or free entrances one day a week, some for Colorado residents only.
It also has active pop, jazz, jam, folk, and classical music scenes. Of particular note is Denver’s importance in the folk scene of the 1960s and 1970s. Well-known folk artists such as Bob Dylan, Judy Collins and John Denver lived in Denver at various points during this time and performed at local clubs.
One phenomenon experiencing a resurgence in Denver of late is the Speakeasy, a “hidden” bar. To get to one, you have to sneak through a refrigerator door; to reach another, a picture frame; and a third is accessed through a sneaker shop (and also known as a “sneakeasy”). But there are many more popping up around the city.
Another year-round attraction is Solutions Escapology, which hosts five different escape rooms and a cheese-oriented restaurant. These essentially challenge you to figure out an escape route before your time is up, typically an hour.
There are several day trips, tours, and excursions that are popular at this time of year.
- Red Rocks & Golden – it’s past the height of the tourist season for this natural wonder but that can be an advantage; the site is open all year. Particularly for the more active, the Trading Post Loop Hiking Trail is a 1.4-mile trip through the spectacular rock formations, valleys, and a natural meadow. Golden is a nearby town which features shopping, restaurants, and attractions all with an old-west theme for lovers of the cowboy genre.
- Denver Botanic Gardens & Chatfield – the Gardens boast of one of the ‘most compelling tropical plant displays in the country’ and that things are still blooming. Quite obviously, that means a climate-controlled break from the ever-present cold. Tours last about an hour. Afterwards, most people head for the Gardens’ Chatfield location which deals with the local ecology and features nature trails, a wildlife observation area, display gardens, educational exhibits, a historical farm, a 19th century one-room schoolhouse, working beehives and picnic areas. From late November (they get an early start) through to January 5th, the Gardens mount their “Blossoms Of Light” display, an interactive light-show built around a huge array of sound-reactive LEDs.
- Central City & Black Hawk – Denver was originally settled as a gold-mining community, and for me, that’s the big attraction of this one-two punch. There are mine tours, mining museums and several places offering instruction in the fine art of in-stream gold panning where a half billion dollars of the coveted, shiny metal was once found. Others may be drawn to the more than 30 casinos in these two towns located 55km (34 miles) west of Denver. In 2009, stake limits were raised to $100, in a bid to attract higher-rollers. The towns are also known for having some of the best-preserved Victorian architecture in the West.
- Rocky Mountain National Park – Even in Australia we’ve heard of this legendary preserve, just an hour out. Some of the most picturesque scenes of the season are to be found here, accessible only with snowshoe-hikes or cross-country skiing. Hiking trails can be open at any time of year, thanks to the effects of the Chinook; visitors should check with Park Rangers for information on what’s accessible and how to choose the right trail for your experience and stamina.
- Anyone from the US, dig around for some loose change. If you see a small “D” stamped on one of your coins, it was produced by the Denver branch of the US Mint, who manufacture 50 million coins a day. I was seven or eight years old when I toured the Australian Mint, and I can still remember some of what I saw as though it were yesterday; anyone who’s had a similar experience is sure to want to pass it on to the next generation or simply relive it. And if you haven’t, there is the fascination of doing something new. So expect tours through the Mint to be popular all year round.
- Free tours through the Colorado State Capital Building take place from 10AM to 3PM five days a week.
- The Denver Story Trek is billed as an interactive exploration of the stories behind the city’s landscapes and landmarks. And it’s free.
- The Great Divide Brewery in downtown Denver specializes in Craft Beers and has free tours.
- Littleton Museum focuses on Colorado’s pioneering days. Located on 39 acres, the museum consists of two living history farms (one from the 1860s and one from the 1890s), with a working farm, a blacksmith shop and more than 40,000 historically Colorado artifacts.
- Coors Brewery is the largest in the world. Free tours show the brewing process from start to finish and ends with free samples for those over 21.
- Dinosaur Ridge features Jurassic fossils discovered in 1877, and Cretaceous dinosaur footprints. Tours are self-guided but guidebooks are available.
- Celestial Seasonings is a company I hadn’t heard of before (unlike Coors). They are the largest specialty tea manufacturer in North America. Tours show how they blend, package, and ship their products, takes you through a gallery of original artwork from their tea boxes, and gives out free samples of every variety they make. All for nix.
- The National Center for Atmospheric Research will educate the tourist about Global Warming – but if that holds little attraction (many don’t believe in it, it has to be admitted), there are other displays to hold your attention and make this free attraction worthwhile. View a hailstone the size of a softball, watch a miniature tornado get created right in front of you, and get a look up close at how lightning is created. These are phenomena that affect us all to some extent, and where better to come to grips with them?
- On the first Friday of every month, the First Friday Tour explores Denver’s artistic communities through all seven of the art districts (six more than many other cities can boast)! Galleries, studios, and exhibitions stay open late for “a mind-expanding night of art, food, drink and fun.” It’s worth noting that the two “extra events” not counted in the “museums and galleries” notes above are (were) both parts of this Tour.
- The Royal Gorge Route is a unique train service that is around 2 to 2.5 hours and offers breakfast, lunch, or dinner on its route by the Arkansas River. With a fully equipped bar, you can enjoy the scenery of Colorado by sitting on a train with a beer in your hand. In the Holiday season, they also have a Santa Express Train (early bookings essential). Tickets can be pricey at $44-plus a head. This is just one of at least seven different scenic train rides through different parts of Colorado.
There are several noteworthy events during the winter Season. While many cities start their “winter seasons” on Thanksgiving Day, Denver (and Colorado in general) date their season from December first, perhaps because Thanksgiving doesn’t signal a season change in weather as strongly as in other places.
- One of the first events of the Winter is the Denver Parade Of Lights, which “snakes through downtown from the Civic Center to Skyline Park and back again on a two mile route”. Floats, Marching Bands and more, “all taking place after dark under the magic of twinkling lights” – other cities have parades, but this is the first night-time one in the US to come to my attention and it may very well be unique for that reason.
- The Denver Zoo is open all year, of course, but in Winter they cover all 70 acres with lights including a number of animated animal sculptures and provide nightly activities across the park.
- Starting in mid-December and continuing through to March, “Our Gang” have hosted ice racing at Georgetown, 45 minutes out of the city, for the last 42 years. 2018 is the first year that they have been forced to cancel the season due to insufficiency of the ice cover when it became clear that they weren’t going to get the ice they needed. Kudos to them for a safety-first prioritization, Commiserations for missing the racing. Entry is free.
- December 16 2018 was the date of this year’s benefit for “One Warm Coat”, which provides free warm coats to anyone who needs one, the “Ugly Sweater Run”, a 3.1-mile fun run through downtown Denver, ending at the finish line with “fake snow, warm hot chocolate, and a Kahlua cocktail”. Participation is $45 a head, but the cause is worthy and the participants enthusiastic.
- Late in December or early in January, the city of Dillon, 1hr 45m from Denver, is one of a handful of locations to construct an Ice Castle. These are “kind of like being inside a glacier or a Narnia-type scene where you have towers and tunnels and archways and everything’s frozen.” The story of how they were invented is engaging, you can read it (and see some stunning photos) at 303Magazine.com in an article by Marissa Kozma, one of their travel and lifestyle writers. The first public Ice Castle went up in 2010 and they have been growing in popularity as a winter attraction ever since. Cities “all over North America” have requested them, and in 2018, they were in Midway, Utah, Stillwater, Minnesota, Lincoln, New Hampshire, Winnipeg, Manitoba and Edmonton, Alberta in addition to Dillon, Colorado. They remain open 6 days a week both day and night (usually 4PM to 8/9/10 PM) until they melt, typically six to eight weeks after construction, but one year in Utah, “it was so abnormally warm, the castle closed after only three days.” Tickets start at $15.95 for pre-booked admission. There is a link in the article to the official website if you want more details.
- New Year’s Eve: The best place to view Denver’s fireworks and mini-parade, which features magicians, costumed performers, balloon artists, and other family-friendly attractions, is the 16th street Mall in downtown Denver.
January, as in most locations, is relatively quiet – if you exclude all those non-seasonal things-to-do listed earlier!
- The National Western Stock Show & Rodeo took place from Jan 6 to Jan 21 in 2018, and has been a tradition since 1906. The most attention-grabbing part of the show is perhaps the Kick-off Parade, when ranchers on horseback march long-horned cattle through downtown Denver.
- From Jan 11 to 14, the Denver International Sportsmen’s Expo brought together hundreds of vendors to display the latest in outdoors gear.
- March 15th saw the “Martin Luther King Marade” (NOT a typo), described as ” the largest parade and rally of its kind in the country.” The concept appears to be that you are expected to join the parade as a participant. The memorial parade begins at City Park and then marchers continue to Civic Center Park, with the final stop at the Colorado State Capitol Building.
- I mentioned the Red Rocks Amphitheater earlier. On January 26, they held a special event, “Icelantic Winter on the Rocks”. This is a naturally-formed rock formation that is acoustically-perfect (and surrounding park) and used as a unique venue for live music.
- January 26-27 this year was the Winter Brew Fest, which celebrates the beer-brewing history of Colorado by drawing together all the major brewers and microbreweries in one place so you can taste all their wares. Tickets are limited to give the festival an intimate ambiance, so booking ahead is essential.
February gets even busier.
- On the first of the month, “Ales, Apps, & Barrels of Fun” took place at the Marsico Campus of the Children’s Museum Of Denver, but it was an adults-only event for those aged 21 and over. Taste beers from local breweries, snack on light bites, and best of all, enjoy an evening of play (starts 7PM) in “world-class exhibits”: Build and launch rockets, see who can make the biggest bubble, race to the top of Altitude and so much more. The thought of using alcohol to impair adults back to childhood levels of physical activity appeals to me for some reason, and some of these sound like fun even for the teetotaler!
- If the Broncos don’t make the Superbowl, some residents like to distract themselves from the game at the “Run 5K on Super Bowl Day” fun-run from Washington Park, with prizes for the best fan ‘gear’. Advance registration required, $35.
- The Fire & Ice Festival in the appropriately named “Loveland” is a pre-Valentine’s special event that features on-site ice sculpture by day and the lighting of fire sculptures by night, plus live music, booze, and a nightly fireworks display, Feb 9th to Feb 11th. Entrance was free in 2018.
- Denver Restaurant Week runs from February 23 to March 4th. Hundreds of the top restaurants and eateries in the city offer multi-course dinners at three different price points to suit everyone from the casual diner to the discerning gourmet seeking something exceptional.
- The Colorado Garden and Home Show nestles alongside Restaurant week on the 2018 Calendar, running from Feb 24 to March 3. This is regarded as the region’s most prestigious show of its type.
- February closes out with yet another charity fun-run, this one the very descriptively-named “Run In Your Undies”. The distance is a “mile-ish” and the cause is a cure for neurofibromatosis. This is more about the party before and after and less about athleticism; participants warm up before (and after) with (presumably alcoholic) drinks. Starts at the Denver Civic Center.< ./li>
Sports are popular all year in Denver. It is one of only 13 US Cities with teams in four different national sporting leagues. Local teams are the Colorado Avalanche (Ice Hockey), Denver Nuggets (NBA Basketball), Colorado Mammoths (National Lacrosse League), Denver Outlaws (Major League Lacrosse), Glendale Raptors (Major League Rugby), University of Denver Hockey (More Ice Hockey), Colorado Rockies (Major League Baseball), Colorado Rapids (Soccer) and (of course), the Denver Broncos (NFL). And that excludes College Sports teams, amateur teams, and unofficial groups, like the Ice Racers listed earlier. And, as usual, sports teams imply sports fans, which imply sports events.
Sources
Primary Sources not linked to within the article:
- Wikipedia’s Denver page;
- Wikipedia’s Colorado page;
- Wikipedia’s Rocky Mountains page;
- Wikipedia’s High Plains page;
- Winter Fun & Outdoor Activities by www.Denver.org aka “Visit Denver”;
- New Year, New Adventures by www.Denver.org aka “Visit Denver”;
- Denver Events This Weekend by www.Denver.org aka “Visit Denver”;
- Free Winter Activities by www.Denver.org aka “Visit Denver”;
- First Friday Art Walks by www.Denver.org aka “Visit Denver”;
- Top 5 Reasons To Visit Denver This Winter by www.Denver.org aka “Visit Denver”;
- Snowpak’s Things To Do In Denver During Winter;
- 11 Free Things To Do In Denver In the Winter, by Diana Rowe “Traveling Grandmom”, for TravelingMom.com;
- 35+ Winter Date Ideas To Keep You From Hibernating by Ashley Adams for 303Magazine.com;
- The Ice Castles Are Back In Colorado This Winter – Here’s What You’ll See by Marissa Kozma for 303Magazine.com;
- Everything You Absolutely Must Do In Denver This Winter by Molly Martin for thrillist.com.
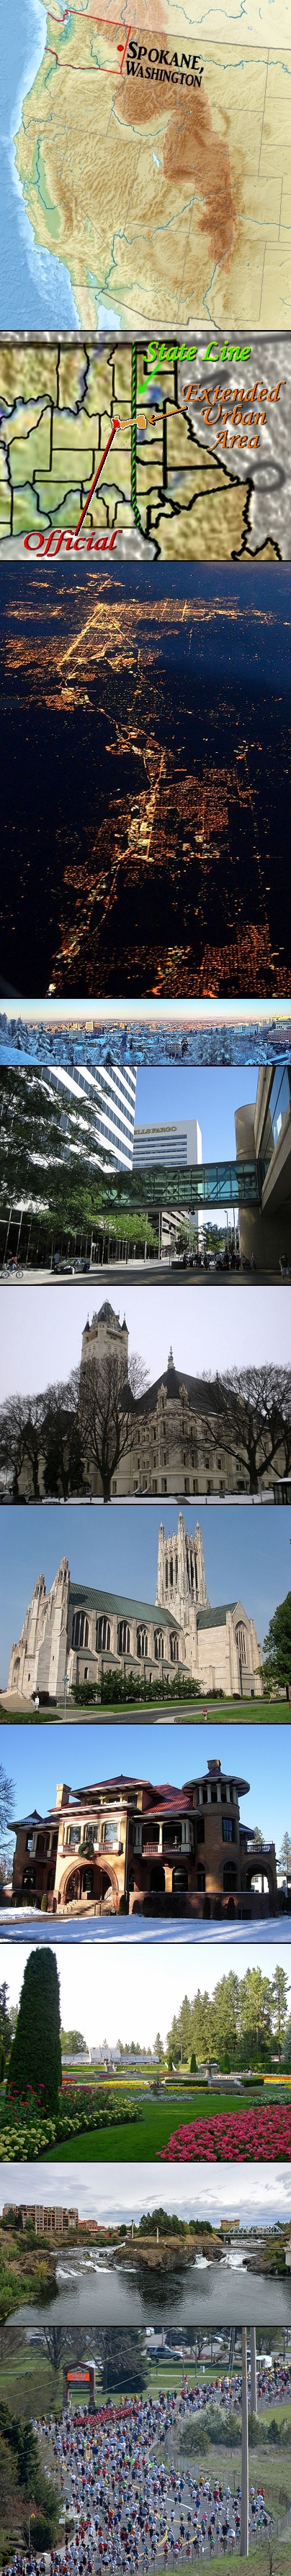
Spokane Montage Content Notes and Credits:
- Spokane Location Map;
- Spokane extended urban area by Mike (refer text). This image combines a public domain physical map of North America, Wikipedia’s map of Spokane within Spokane County within Washington State by Locke Cole, and Iowa County map by DemocraticLuntz (all extensively modified).;
- Night aerial view of Kootenai County, Idaho (foreground) and Spokane County (background) in December 2014 by Cmglee. The communities have grown toward each other in the subsequent four years;
- Downtown Spokane, Washington as seem from Cliff Drive, December 2015 by Jdubman;
- Spokane Skywalks by Declic aka R Rancourt) – these are a common architectural feature of the City which boasts an extensive network of them;
- The Spokane County Courthouse by Murderbike;
- The Cathedral of St John The Evangelist in Spokane by Robert Ashworth of Bellingham, WA, via Wikipedia via Flikr;
- The Patsy Clark Mansion by Murderbike;
- The Duncan Garden at Manito Park and Botanical Gardens by Jdubman at the English language Wikipedia;
- MK02733 Spokane Upper Falls by Martin Kraft, Attribution Required, License CC-BY-3.0 – The falls are shown flowing by Canada Island;
- Runners head down Fort George Wright Drive during Spokane’s 2008 Bloomsday race, photo by Mark Wagner, License CC-BY-2.5.
19. Winter In Spokane, Washington
The “Lilac City” looks so simple on a state-scaled map. A small city (about 209,000 people, 101st largest in the US) in what would be the exact center of Spokane County if it were a perfect rectangle (instead of having a ‘bite’ taken out of it to the northwest. And at first glance, the Wikipedia article detailing the city supports that.
The reality is in the second paragraph, hidden behind the seemingly-innocuous passage, “…and the economic and cultural center of the Spokane Metropolitan Area, the Greater Spokane Area, and the Inland Northwest.”
It’s only when you bring up google maps, zoom down to the individual street level, and start panning around, that the reality of what this means begins to strike home.
Spokane is a set Russian Dolls, with the “official” city nothing more than the innermost layer. The metropolitan area effectively protrudes Northward to encompass Country Homes, Southward to include Glenrose, and Eastward to incorporate Spokane Valley, and further east from there into Idaho and a north-south strip of adjacent urban areas that comprise Post Falls, Coeur d’Alene, Dalton Gardens, and Hayden. What’s more, Rathdrum, Idaho, is just outside this corridor but close enough that it can probably be considered an outer suburb in any practical sense.
Some of these (and more besides) fall into the Spokane Metropolitan Area, which is a full three counties in size. The more is places like Cheney (11,534 people), Liberty Lake (8,906 people) and Airway Heights (6,639 people).
Adjacent to this in Idaho is the Coeur d’Alene Statistical Area, which comprises of the townships named above including Rathdrum, and which also happens to be Kootenai County.
And it should be noted that all this is a simplification of the human geography of the region.
But, when you take away all these artificial divisions away and simply look at the roads, all of the above form one extended metropolis as shown on the second map of the montage. Put them all together and you get the third largest urban area in the Pacific Northwest, bettered only by Seattle and Portland.
The history of the place is not uncommon for these parts: a trading post, connected to everywhere else when the Railroad came through and brought settlers, the discovery of gold and silver, and an economy based on primary production (mining, timber, agriculture) until the 1980s.
During the first half of the 20th century, Spokane seemed to be simply marking time. Slow growth was followed by stagnation was followed by slow growth. The initial decline, in 1910, was largely due to a slowing economy, not helped by the Great Fires of 1889 and 1910.
A saga of flames
All right, there’s a historical can of worms that I tried hard not to open, without success.
1889
[On] August 4, 1889, … a fire, now known as The Great Fire (not to be confused with the Great Fire of 1910, which happened nearby), began just after 6:00 PM. and destroyed the city’s downtown commercial district.
Due to technical problems with a pump station, there was no water pressure in the city when the fire started.
In a desperate bid to starve the fire, firefighters began razing buildings with dynamite. Eventually the winds and the fire died down; 32 blocks of Spokane’s downtown core had been destroyed and one person killed. – Wikipedia
A construction boom naturally followed as Downtown was rebuilt, though not without more than their fair share of setbacks: between 1889 and 1896 alone, all six bridges over the Spokane River were destroyed by floods before their completion.
Nevertheless, the city boomed until the 1910s, as the city became an important rail hub.
1910
The Great Fire of 1910 is also commonly referred to as the Big Blowup, the Big Burn, or the Devil’s Broom fire. It was a wildfire in the western United States that burned about three million acres (4,700 sq mi; 12,100 km2) in two days, August 20-21, killing 87 people, mostly firefighters, and established the profession as public heroes. The cause of the fire has never been officially determined, but the story given below is all-but universally accepted.
Abundant Autumn and Winter rainfall in 1909-1910 promoted a dense undergrowth in the forested regions of the affected states. The Spring and Summer that followed were extremely dry and summer hot enough to be described as “like no other”. The drought produced forests teeming with dry fuel. Individual spot-fires were lit by hot cinders flung from locomotives, sparks, lightning, and back-burning fire crews, and by mid-August, there were 1,000 to 3,000 fires burning across Idaho, Montana, Washington, and British Columbia.
These fires exploded into rolling waves of flame as the sap in the Western White Pine forests that blanketed Idaho boiled and created
“a cloud of highly-flammable gas that blanketed hundreds of square miles, which spontaneously detonated dozens of times, each time sending tongues of flame thousands of feet into the sky” – Wikipedia
…which created the heat conditions to generate a new release of hydrocarbon gas, a self-perpetuating cycle that destroyed everything it touched.
Smoke from the fire was said to have been seen as far east as Watertown, New York, and as far south as Denver, Colorado. It was reported that at night, five hundred miles (800 km) out into the Pacific Ocean, ships could not navigate by the stars because the sky was cloudy with smoke. – Wikipedia
And then the fire became the inferno that earned it the rather graphic appellations given earlier. On August 20, a cold front blew and brought hurricane-force winds, whipping these hundreds or thousands of small fires into one or two huge conflagrations. The resulting fire was impossible to fight; there were too few men, too little supplies, and not enough expertise or technology. It ultimately collapsed when another cold front swept in, carrying steady rain.
Even today, with the full gamut of national resources and expertise, experience tells me that firefighters would struggle to cope with such a perfect storm of conditions. So much of this story is reminiscent of regular events here in Australia, such as the Ash Wednesday fires of 1983, the Black Saturday bushfires of 2009, and the Black Christmas bushfires of 2001-2002.
But it was time of industrial economic change, and that was the real killer; everything else was only a temporary setback. Control of mines and resources became increasingly dominated by national corporations rather than local people and organizations, which diverted capital away from the local economy of the city (and to the economies in which those corporations were based). This decreased growth and investment opportunities in Spokane, which made the city less attractive to investors and further slowed growth.
With mining in decline, agriculture and logging becoming the dominant forces in the local economy. The population explosion and the building of homes, railroads, and mines in northern Idaho and southern British Columbia fueled the logging industry in particular.
Although Spokane’s resources were overshadowed in importance by the vast timbered areas on the coastal regions west of the Cascades, and the local industry was handicapped by monopolistic rail freight rates and stiff competition, it nevertheless rode the boom to become a noted leader in the manufacture of doors, window sashes, blinds, and other planing mill products. – Wikipedia
The railroad industry was already killing the goose that laid the golden eggs, so far as Spokane was concerned. Rail freight rates were so much higher in Spokane than those in coastal seaport cities such as Seattle and Portland that Minneapolis merchants could ship goods first to Seattle and then back to Spokane for less than shipping directly to Spokane, even though the rail line to Seattle ran through Spokane on the way to the coast.
This situation could not last; freight rates eventually fell to more rational levels, but by then the local logging economy was limping – not moribund, but not really growing, either. As the logging interests consolidated, this economic stagnation became entrenched within the local industry.
During this time of stagnation, unrest was prevalent among the area’s unemployed, who were victimized by “job sharks”, which charged a fee for signing up workers in the logging camps. Job sharks and employment agencies were known to cheat itinerant workers, sometimes paying bribes to periodically fire entire work crews, thus generating repetitive fees for themselves.
Crime spiked in the 1890s and 1900s, with eruptions of violent activity involving unions such as the Industrial Workers of the World (IWW), or “Wobblies” as they were often known, whose free speech fights had begun to garner national attention. – Wikipedia
The unethical practices of recruiters gave the IWW a legitimate grievance that turned Spokane into a flash-point of industrial unrest. Union members from many western states came to Spokane to participate in what was a deliberate publicity stunt, a fight over Free Speech and local ordinances on Soapboxing that was symbolic of the broader conflict between Workers and Profits that continues to evolve to this day.
When your city economy rests on three pillars and two of them are on shaky ground, you had better hope for good things from the third. It can be argued that agricultural success kept Spokane alive.
Initially, the region was thought to be unsuitable for wheat production due to the hilly terrain; there was a common belief that wheat could not be cultivated on the tops of the hills. When wheat was first planted in the region in the late 1850s, it was discovered that this was false, and the region became a breadbasket.
Inland Empire farmers exported wheat, livestock, and other agriproducts to ports such New York, Liverpool, and Tokyo. These days, the region south of Spokane is one of the largest wheat producing regions in the United States. A large share of that production is exported to Far East markets. The agricultural economy has also diversified, supporting many vineyards and microbreweries.
But it wasn’t enough at the time to sustain growth; the 1920 census showed a population increase of just 35 over the preceding decade. Since this is far less than the natural growth of the then population, it shows that thousands were, in fact, leaving the city.
In the 20s and 30s, to generate any sort of growth, those attempting to boost the city were forced to market it as a quiet, comfortable place suitable for raising a family rather than as a dynamic community bursting with opportunity. A brief improvement in the city’s fortunes occurred during WWII, when the cheap electricity available in the area from the many local dams stimulated local aluminum production, a material much in demand for aircraft. Post-war, this demand waned, proving this boost to have been a temporary lifeline.
In the early 1960s, an organization naming itself Spokane Unlimited sought to revitalize downtown Spokane and lift the city out of this malaise. They successfully hosted the first environmentally-themed World’s Fair in 1974, in the process sweeping away a century of railroad infrastructure and reinventing the urban core. The actual site of “Expo ’74” became the 100-acre Riverfront Park after the event.
This kick-started the city, which experienced a boom through the late 1970s and early 1980s, interrupted only by a nationwide recession in 1981 in which Silver, Timber, and Agricultural Product prices dropped. This triggered a period of slow decline which lasted into the 1990s and exacerbated by the loss of many blue-collar jobs in the manufacturing sector. Eventually, though, the diversification made possible by the reinvention of the city in the 60s and 70s enabled it to escape this downward slide and begin to transition to a service-oriented economy, a process that continues to this day.
Along the way, Spokane has seen the emergence of a number of features unique to the city, a unified patchwork of styles that sets it apart when taken as an aggregate. An example is the extensive network of skywalks that interconnect a number of buildings in the downtown area, a concept that remains somewhat controversial to this day – see, for example, this discussion on the metrospokane website.
I’d like to have provided a map to illustrate just what is meant by the term “extensive”, but I couldn’t find one that wasn’t copyright-restricted, so you’ll have to settle to a link to an 8-years-out-of-date map at Experience Spokane (Zoom in to see the skywalk network, which is a silvery-gray in color. Look for the yellow buildings and City Hall, which is a middle-gray).
Other Architectural & Cultural Features
Spokane neighborhoods contain a patchwork of architectural styles that give them a distinct identity and illustrate the changes [that have taken place in the course of] the city’s history. – Wikipedia
Most of Spokane’s notable buildings and landmarks are in the Riverside neighborhood and the downtown commercial district, where many of the buildings were rebuilt after the Great Fire of 1889 in what is known as the “Romanesque Revival” style. The principle architect of this reconstruction was a self-taught designer named Kirtland Kelsey Cutter, who got his start designing “Chalet Hohenstein” for himself and other residences for his family, all while supporting himself working as a bank teller.
The next great wave of construction/reconstruction was in the 1960s and 70s and was in the Modernist style.
As a general rule, you can observe the history of the prosperity of the city by noting which styles are well-represented in the patchwork; renewal occurs when the economy booms.
An early affluent Spokane neighborhood, the Browne’s Addition neighborhood, contains the largest variety of residential architecture in the city. Residences are lavish and personalized, featuring many architecture styles that were popular and trendy in the Pacific Northwest from the late 19th century to 1930.
Much of Spokane’s parkland was acquired prior to WWI, and in 1907 the board of Park Commissioners retained influential landscape architects, the Olmsted Brothers, to draw up a plan for those Parks, establishing the city as a leader amongst western cities in the development of a citywide system of parks, an approach that is commonplace in modern times.
Spokane is also known as the birthplace of the movement that eventually led to Father’s Day being established as a National Holiday in the USA.
Topography notes
The lowest elevation in the city of Spokane is the northernmost point of the Spokane River that lies within the city limits, in Riverside State Park: 490m (1,608 feet). The highest elevation is on the northeast side, near Beacon Hill and the North Hill Reservoir,: 790m (2,591 feet). That’s a difference of 300m (983 feet), which is not an inconsiderable range and reflects the city’s location in the western fringes of the Rocky Mountains.
Of course, it’s not that simple. The city lies on a steppe plain west of the Selkirk Mountains, the sharply-rising foothills of the Rockies. Ecologically, the city is situated at the transition point between two different neighboring ecologies; to the east lie the Columbia Basin and the coniferous forests of the Rockies; to the south are prairies and rolling hills.
Demographics
Spokane has been criticized and sometimes derided for its lack of diversity and mono-cultural society, but recent decades have brought about an increase in diversity that renders the stereotype out-of-date.
Spokane and its metro area in general, particularly northern Idaho, has been stigmatized in the popular consciousness by a number of hate groups that were set up in and around Coeur d’Alene, Idaho. Low ethnic diversity made the region a destination for some seeking to escape more cosmopolitan cities for a locale with a relatively homogeneous, white population, a trend that accelerated with the arrival of retired engineer Richard Butler from California to (eventually) establish the white supremacist church better known by the name of its political arm, the Aryan Nations, who were responsible fro several hate crimes and terror plots during the 1980s and 90s. The group became defunct in 2000 when the Southern Poverty Law Center filed a civil suit against them, winning a $6.3 million dollar settlement that eventually bankrupted the organization and caused the closure of their compound.
Another significant act of hate was the attempted bombing of Spokane’s Martin Luther King Day Parade by Kevin Harpham of Addy, Washington in 2011.
The Southern Poverty Law Center currently lists three hate groups in the Spokane and Coeur d’Alene metro areas, in the categories of anti-Muslim, Holocaust denial, and general hate.
But even as the Aryan Nation were at their zenith in terms of “political activity,” their grounds for choosing this location were being undermined by a new cosmopolitanism. Following the collapse of the Soviet Union in 1991, there was a substantial wave of immigration from countries in the former Soviet State (especially Russians and Ukrainians), who now form a comparatively large demographic in Spokane and Spokane County.
There is also a strong Latino demographic. And among the fastest-growing smaller demographics in Spokane is the Pacific Islander ethnic group, which is estimated to be the third largest minority group in the county.
Spokane was once home to a sizable Asian community, mostly Japanese, centered in a district called Chinatown from the early days of the city until 1974, even though that was both a misnomer and culturally insensitive to a degree that would not be tolerable in modern times. As in many western railway towns, the Asian community started off as an encampment for migrant laborers working on the railroads. This Asian community thrived until the 1940s, after which its population decreased and became integrated and dispersed, losing its Asian character; urban blight and the preparations leading up to Expo ’74 led to the demolition of “Chinatown”.
Perhaps nothing speaks to the transformation undergone by the city in the 21st century more strongly than the gay and lesbian Spokane Pride Parade, held each June, and the Spokane Gay & Lesbian Film Festival, held every November, which features contemporary, independent films of interest to the LGBT community. The acceptance of these events as part of the cultural landscape demonstrates clearly how much things have changed since the 1990s when diversity was a much-maligned dirty word.
Climate: The big picture
Spokane has been a rules-breaker since the days of the IWW, more than a century ago – sometimes in good ways, and sometimes in bad. Although nicknamed the Lilac City from a flowering shrub that has flourished since being introduced in the early 20th century, after the history conveyed above, I feel it is equally deserving of the name “The Teflon City” – in the same sense that John Gotti used to be known as the “Teflon Don”. No matter how bad things got for them, none of the undoubted misfortune experienced seems to have stuck to them. Other cities, faced with the challenges dealt Spokane, could have collapsed; instead, the city simply languished in the doldrums until someone found another avenue to good times.
It’s somehow fitting that the climate of the city is also a noted rules-breaker. Officially, it’s a humid continental climate, which is considered a rare climatic type because of its elevation and significant winter precipitation requirements. Spokane, however, is adjacent to, and sometimes classified as part of, a region with a warm-Summer Mediterranean Climate, because the average temperature for the coldest month is just over -3°C (26.6°F). In truth, and in keeping with the modern diversity underpinning the city, it shares some features of both, revealing just how arbitrary the lines between different climatic types really is at times, and how complex real weather can be – for all that there are obvious patterns and correlations within the phenomena.
As you might expect from so large an extended city, there’s a wealth of data that’s applicable to some extent. Wikipedia’s page on Spokane provides complete records for Spokane International Airport, Supplemented by partial records from 1953-1983 at Riverside Park, and by partial records from Felts Field Airport, close to the border with Idaho. There are substantial differences between these records.
But Post Falls, for example, has weather that is only similar to the records for the three Spokane sources. And I suspect that the weather would only grow more diverse if I went looking for other data points. Still similar, but the devil’s in the detail, as has been shown a number of times.
Rather than bury both myself and the reader in confusing details, I’m going to simply summarize the differences and then treat the international airport as “THE weather” of Spokane.
Riverside: Hotter in late summer, cooler or the same the rest of the year, warmer at night in Winter and Spring, significantly cooler in Autumn. Marginally wetter all year round, and receives a LOT less snow.
Felts Field: Record temps, both high and low, are 6°F (or more) hotter all year round, both days and nights. Normal temps are all 4°F hotter. Some months are slightly wetter, and some slightly drier, but any pattern is obscure; as a general rule, the amounts are only 0.3” or so in the course of a month.
Post Falls, Idaho: officially a “dry-summer continental climate”. Remember that, and that Spokane has officially either a “humid continental climate” or a “warm-Summer Mediterranean Climate” (depending on who you ask), both of which sound like they would be rather more moist than that of Post Falls. In fact, Post Falls experiences considerably more rainfall than the Spokane reference – in fact, up to 2 1/2 inches more, depending on the month. Some months, Post Falls gets double the rainfall of it’s western neighbor. Your immediate suspicion might be that Post Falls receives less snow, but once again, this is not born out by the records, where up to six inches more can fall in January and lesser increases at other times. What’s more, Post Falls only has three months with snow-less records; Spokane has four and very nearly six or seven.
No, what’s going on here is the other side of the Chinook Wind phenomenon – all that moisture and precipitation has to go somewhere. You could say (inaccurately) that Denver is in Post Falls’ “Chinook Shadow”. If you corrected the places referred to, you could even make that a reasonably accurate statement, because the principle is correct.
What this shows is how sharply the Chinook “precipitation dump” effect falls off. The distance between the two is only 25 miles; it takes less than half an hour to drive from one to the other via the I-90, but there are both pronounced similarities and profound differences between their respective climates.
“Proximity to elevation”, relative to the prevailing winds over water-sources, is thus revealed as a critical factor when it comes to the climate actually experienced by a region.
Spokane’s location, between the Cascades Range to the west and the Rocky Mountains to the east and north, protects it from weather patterns experienced in other parts of the Pacific Northwest. The Cascade Mountains form a barrier to the eastward flow of moist and relatively mild air from the Pacific Ocean in winter and cool air in summer.
Climate: Specifics Analysis
There is no pronounced dividing line between the primary seasons and the transition seasons. The changes tend to be more gradual between a high-point and a low-point. The two primary seasons are quite distinct, but there beginnings and endings are a little fuzzier. Nevertheless, there are four distinct seasons experienced in Spokane.
Winter, at first glance, is normally December through February, but it regularly starts early and can occasionally linger into March. The months that bookend each year are the clear “heart” of the winter season. It is as correct to describe Winter as two months long as it is to consider it to be three or even four months in duration; it’s all about where you draw the classification “dividing line”.
I am going to consider winter as commencing in November because of a marked similarity between snowfall levels in February and those of November; if one is designated “Winter”, the other should be too, according to this observed pattern. In effect, Winter has stolen an Autumn month, making for a sharper transition between the hot and cold seasons, a pattern that is reflective of the actual situation revealed by the climatic data. It is this accuracy of impression that I consider the decisive argument.
So the seasons of Spokane, for the purposes of this series, are:
- Winter: November, December, January, and February;
- Spring: March, April, and May;
- Summer: June, July, and August;
- Autumn: September and October.
So, to analysis of the Winter records, starting as usual with the daily temperature highs: Winter tends to arrive suddenly. There is a 10°C (17°C) difference between the record highs of October and November respectively. This is the biggest month-on-month change in the course of the year, though the March-April change is almost as great. The hottest temperatures on record are Nov 21°C (70°F), Dec 16°C (60°F), Jan 17°C (62°F), and February 17°C (63°F).
The typical highs of each day in these months are far cooler. Nov 5.3°C (41.6°F), Dec 0.1°C (32.2°F), Jan 1.3°C (34.4°F), and Feb 4.2°C (39.6°F). However, not all days are this extreme; temperatures of Nov 13.4°C (56.2°F), Dec 8.3°C (46.9°F), Jan 8.6°C (47.4°F), and Feb 11°C (51.8°F) occur at least once each month.
The overwhelming impression created by these numbers is one of an extreme symmetry to the season. The temperatures plunge until they reach bottom, then rise again. All else is “passing noise” in the pattern. It will be interesting to see if that pattern also occurs in the daily minimums.
Most nights (presumably) are below freezing, sometimes by quite some margin. Typical daily minimums are Nov -1.2°C (29.8°F), Dec -5.3°C (22.5°F), Jan -4.1°C (24.7°F), and Feb -3.1°C (26.4°F). But at least once in a season, those minimums are exceeded (in the wrong direction): Nov -10.9°C (12.3°F), Dec -16.1°C (3°F), Jan -15.9°C (3.3°F), and Feb -12.9°C (8.7°F), respectively, and minimums are below zero regularly in Autumn and Spring, as well.
With chilly minimums such a recurring feature of the climate, it’s no surprise that the record minimums are extremely frosty. Nov -25°C (-13°F), Dec -32°C (-25°F), Jan -34°C (-30°F), and Feb -31°C (-24°F).
Despite this impression, the Rockies shield Spokane from some of the coldest air masses traveling southward from Canada. It could, in other words, be much colder. This also suggests that wind speeds, and hence windchill effects, are also relatively moderate – compared to what they could be.
Temperatures of less than -23°C (-10°F) are rare, and typically only 3.5 days a year average below -18°C (0°F).
As a season, winter is the wettest month. Because of the rain shadow effect of the Cascades, the Spokane area has 420mm (16.5”) average annual precipitation, less than half of that of the (unprotected) Seattle. However, there is a second annual peak in late Spring which is important to the agriculture of the region, and which can produce heavy fire loads in a summer that is already hot and dry. Within the season, November and December are the wettest months, both receiving 58.4mm (2.3”) on 13.7 and 13.2 rainy days, respectively. This also shows that individual falls are slightly heavier later in the year. In January, the average falls to 45.5mm (1.79”) over 13.4 rainy days, so this trend doesn’t last. February receives 33.8mm (1.33”) over 10.4 rainy days, but it is the shortest month of the year; if it were a more typical length, these numbers would be 36.5mm (1.44”) and 11.2 days. If you compare these, you find that not only are the falls decreasing in frequency but they are also becoming lighter.
The defining visual image of Spokane’s winter climate, though, is snow. While rare, at least one incident of snowfall in October and another in May, of virtually-identical intensity, have taken place; snow is a regular feature of the months in between. The peak occurs in December, and would trend toward the 3rd-4th week of that month, i.e. Christmas. Residents of Spokane don’t have to dream of a White Christmas and probably wouldn’t consider it anything to look forward to.
It is worth bearing in mind that snowfalls happen with roughly half the frequency of rainfall while considering the actual averages: November, 4.9 snow days yield 18.8cm (7.4”); December, 9.8 days produce 37.1cm (14.6”) of cover; January, 9 snow days generate 29cm (11.4”) of snow; and in February, the typical experience is 5 snow days and 17.3cm (6.8”). Falls generally persist into mid-Spring, decreasing in frequency and severity.
While late Summer and early autumn see relatively clear skies, the frequency of cloud cover rockets as Winter approaches. In November, only 26% of the possible sunlight actually reaches the city, in December that falls to only 22%, and in January the average is 28%. In February, this rises to 41% – 4 clear days for every 6 cloudy ones – and throughout Spring this slowly increases. But clouds are a recurring fact of life in all but the hottest months, and winter is when they are most ever-present.
Winter Events
The appeal of covered walkways between major buildings becomes far more understandable after considering these weather patterns. In fact, the reader could be forgiven for a suspicion that the regular rainfalls, however light, might put something of a damper on the social scene; Spokane was ranked as having the 4th ‘most depressing’ Winter in the US, after all. Spokane even struggles to promote any specific local activity themed around Christmas.
Outside of Winter there’s plenty going on, and there are a few events that occur regularly despite the season.
There’s an active Arts subculture concentrated in three districts. Like Denver, Spokane has First Friday art walks. Twice a year, these build to a crescendo – the first Friday each of October and February – which attract large crowds to the art districts within Davenport, the Garland Business District, and East Sprague. The first of these also has the highest concentration of art galleries and is also home to many of the main venues for the Performing Arts.
“The Knitting Factory is a concert house that serves as a setting for many mainstream touring musicians and acts.
“The Martin Woldson Theater at the Fox, restored to its original 1931 Art Deco state after years of being derelict is home to the Spokane Symphony Orchestra.
“The Metropolitan Performing Arts Center was restored in 1988 and renamed the Bing Crosby Theater in 2006 to honor the former Spokanite.
Touring stand-up comedians are hosted by the Spokane Comedy Club.
Theater is provided by Spokane’s only resident professional company, The Modern Theater, though there are also the Spokane Civic Theatre and several other amateur community theaters and smaller groups.
The INB Performing Arts Center is often host to large traveling exhibitions, shows, and tours.” – Wikipedia
Spokane is considered somewhat deficient in terms of grassroots-level musical venues, though there are a number of higher-level venues and groups, such as the Spokane Symphony Orchestra (mentioned above), which presents a full season of classical music each year, and the Spokane Jazz Orchestra, which does likewise for their genre.
Similarly, there are a range of museums catering to everything from art to local history to science and technology.
But in terms of big local events, the schedule favors the warmer months, which are home to everything from the annual Lilac Bloomsday Run to the Spokane Hoopfest (a 3-on-3 basketball tournament) to Pig Out In The Park, an annual six-day food and entertainment festival which features free concerts featuring local, regional, and national recording artists in Riverfront Park.
What major events do occur in the Winter Season are indoors in nature. November brings the Spokane Gay & Lesbian Film Festival (mentioned earlier), while the Spokane International Film Festival (a small, juried festival that features documentaries and shorts from around the world) is a February event.
There is an annual Renaissance Faire but no indication of what time of year it calls home.
There are five ski resorts in the region and this is their peak season (for obvious reasons).
The INB Performing Arts Center hosts the WCE Best of Broadway at the end of each year.
The Spokane Symphony’s concert season continues through the winter. You can also stop by the Historic Davenport Hotel which has an annual Christmas Trees display and sells raffle tickets to win the decorated trees, with funds going to support the Symphony. The display and raffle are about a week long and are a genuine seasonal highlight.
And the last week of February is the time of year for the Inlander Restaurant Week – just like Denver, the best restaurants create three-course fixed-price menus for this celebratory period. The Menus are generally made public in early February to give patrons the chance to plan their gastronomic tours.
Primary Sources
- Wikipedia’s Spokane, Washington page;
- Spokane Winter by Visit Spokane .com.

Seattle Montage notes and credits:
- Seattle Location Map
- Seattle within Washington – based on “King County Washington Incorporated and Unincorporated areas Seattle Highlighted” by Arkyan, which – in turn – is based on similar map concepts by Ixnayonthetimmay.
- Puget Sound Modus Image by NASA – a cropped version of an image photographed for an unrelated purpose, part of the NASA Visible Earth Collection.
- Map of Puget Sound and its main basins by Pfly
- Puget Sound, photograph MrsBrown via Pixabay License CC0
- Deception Pass, Puget Sound, by Patrick_McNally via Wikipedia Commons via Panoramio
- Seattle Columbia Panorama 02 by Patrick Rodriguez – the city as seen from the Sky View Observatory atop the Columbia Center.
- The Seattle Space Needle image by Pexels via Pixabay, license CC0 Creative Commons
- Aerial view of Lake Union by Jelson25 – this photograph shows boats gathering on Seattle’s Lake Union in preparation for the July 4 fireworks display that evening and is a cropped version of the original.
- Seattle Central Library viewed from 5th Ave License GFDL
- Amazon.com’s “Day 1” Tower by Adamajreynolds, License CC-BY-SA 4.0
- The Quad of the University Of Washington, Spring 2007 by Punctured Bicycle, Public Domain image
- Safeco Baseball Field by sweeneytime via Pixabay, License CC0 Creative Commons
20. Winter In Seattle, Washington
Any time that you use a real-world location with which you have no personal experience for any purpose – be it literary, factual, or in an RPG – you are forced to confront the difference between what you think you know and what you really do know about that location. This is something that I’ve had to do repeatedly in the course of this series, and Seattle is no exception.
My awareness of the place is that it’s on the West Coast of the USA, up in the extreme north of the contiguous continental states, and beyond that there is a confused melange of unreliable impressions more accurately ascribable to the New England region, such as “Whale Hunting” and “snow”. And there’s a vague association with Soundgarden. Or maybe it’s a different band.
Of course, you may be able to get away with such vagueness if your audience – your players, in the case of an RPG, or my readers, in the case of this blog – know no better than you. For example, most North Americans would have known very little about Sydney, so a GM setting an adventure in my city would be able to get away without a great deal of research and the players probably wouldn’t notice.
Given that most of my readers are North American, and predominantly from the US, that won’t work in this case – if I screw up, or do a half-arsed job, someone’s sure to spot it. The only solution is to do the very best research job that I can, because your credibility suffers massively from even a single case of getting it wrong through inadequacy of research. If you can spot that I’m talking through my hat in an area about which you know better, you are that much less-inclined to trust my work on a place about which you know nothing.
Worse still, most RPG players are sponges for factual information. When I use, say, Rome in an adventure, I can never be sure in advance of what my players might know about the place. So I have to maintain the most scrupulous standards that I can manage just to achieve a reasonable suspension of disbelief.
And that means that thee unreliable gestalt of vague and uncertain impressions needs to be shown the door unless they can be validated through factual research.
In a way, that’s what this entire series is about – on the local scale, it’s about the weather experienced by different specific locations that have been selected to be representative of various climates and geographic locations; on the regional scale, it’s about using local climatic data as a template for similar locations, knowing that there will be some inherent level of inaccuracy in doing so; and on the broadest scale, it’s about my understanding of the weather, confronting the numerous errors and patches of nebulous vagueness in my knowledge on the subject, and passing the resulting factual foundation on to you, my readers, for your own use.
Seattle was chosen because my research indicated that there was a uniqueness to San Francisco that made it unrepresentative of the West Coast as a whole, and because I was already reporting on Spokane, Washington, a location that is specifically described in various sources as being sheltered from the climatic influences to which Seattle is subject. To get the complete picture, then, you needed both Spokane and Seattle.
Okay, so the first thing you notice about Seattle is that for a coastal city, it seems to be an awfully long way inland. This is one case in which appearances are highly deceptive, and the error can be summed up in a single two-word name: Puget Sound.
Puget Sound
A ‘sound’ (in geographic terminology) is a “sea or ocean inlet larger than a bay, deeper than a bight, and wider than a fjord; or a narrow sea or ocean channel between two bodies of land” (though those are also known as a strait).
Which sounds all nice and precise; the reality is a heck of a lot messier. There’s no consistency to the use of the term, which was often assigned long before the definition was cobbled together.
In the case of Puget Sound, the term is applied to a complex network of estuaries, marine waterways, and basins with three connections (one major and two minor) to the Pacific Ocean. The name was first assigned to the waters of the region south of the Tacoma Narrows by George Vancouver in 1792, and was later extended to include the waters north of the Narrows as well.
In 2009, an attempt to clean up the terminology by the United States Board on Geographic Names led to Puget Sound, plus the Strait of Juan de Fuca and the Strait of Georgia (both of which form part of the international border between the US and Canada), being defined as the “Salish Sea” – but sometimes the terms “Puget Sound” and “Puget Sound and adjacent waters” are used to refer not only to the Puget Sound referred to as part of the Salish Sea but also waters to the north, such as Bellingham Bay and those in the region of the San Juan Islands.
Nine rivers feed into the Sound, however ill-defined it might be, and it forms a major channel to the Pacific. The most practical definition is based on that fact; the waters of the sound are a blend of fresh water and the salt waters of the Pacific. The marine population is a mixture of salt-water life, fresh-water species, and some unique adaptions that exclusively prefer the lower salinity of the Sound.
There are 15 prominent islands within the sound’s one hundred mile length & ten mile width, and six cities are located on its coastline – Seattle, Tacoma, Washington, Olympia, Everett, and Bremerton.
Even before looking at the data and analyses of various sources, I can see from the map of the Sound included in the Photographic Montage that Puget Sound will have a complex relationship with the climate of Seattle. If the wind is from exactly the right direction, it will carry cold, moist, air from the northern Pacific SSE to strike Seattle with minimal interference; but if the source is just a few degrees more from the north, the wind will flow across the icy landmass of western Canada, resulting in a drier and even colder airflow. A few degrees more to the west, and Vancouver Island and/or the expanse of the Olympic Peninsula to the west will provide at least some shield against the winds, a situation that remains in effect through almost 45 degrees of arc. The location map at the start of the montage adds to the story, clearly showing a channel of relatively low ground from the west to the south-west; while these winds would be warmer, there is not a lot of terrain impact to leech the water content out of the air before it gets to Seattle. Everywhere else you look, there is high ground; winds from those points of the compass would incur Chinook effects to at least some extent, making them drier and providing less rainfall for the City.
From this alone, I would expect the weather to be quite literally as fickle as the winds. From the currently-prevailing wind and the season, you would have a reasonable chance to predict the general weather pattern, and from a particular state of the weather and general knowledge of the season, you could probably make a fair stab at guessing the wind direction.
It should be noted that these last two paragraphs are entirely semi-educated guesswork on my part – bold predictions to be validated by examining the actual climatic information, which happens a little later in the article.
A (very brief) History of Seattle
The Seattle area was inhabited by native Americans for at least 4000 years before the first permanent European settlers, now known as the Denny Party, arrived from Illinois via Portland on the Schooner Exact in 1851.
In the following year, the settlement was moved to the eastern shore of Elliott Bay from it’s initial location at Alki Point and renamed “Seattle” after Chief Si’ahl of the local Duwamish and Suquamish tribes.
The first major industry was logging, but by the late 19th century it had become a commercial and ship-building center, serving as the gateway to Alaska during the Klondike Gold Rush.
In 1907, the company that would eventually become UPS was founded in Seattle.
During World War I, a shipbuilding boom took over the city, and the retrenchment of the workforce after the war led to the Seattle General Strike of 1919, which was the first General Strike in the USA. Seattle was mildly prosperous in the 1920s but was particularly hard hit in the Great Depression, experiencing some of the country’s harshest labor strife in that era. Violence during the Maritime Strike of 1934 cost Seattle much of its maritime traffic, which was rerouted to the Port of Los Angeles.
Quite obviously, job-creation programs focus on where the need is greatest, and so Seattle became one of the largest beneficiaries of the New Deal. The residents were subsidized to build roads, parks, dams, schools, railroads, bridges, docks, and even historical and archival record sites and buildings, but this was not enough to stave off the challenge posed by Los Angeles. Seattle’s eastern farm land faded in importance due to the growth of farming in Oregon and the Midwest, forcing people into town, further boosting the unemployment rate.
World War II saved the city, as prosperity returned, centered on Boeing Aircraft. Post-war, this prosperity again dipped, but Boeing grew in strength to dominate the commercial airliner market, and this dip was short-lived. The city became established as a center for aircraft manufacturing, and future prosperity seemed assured.
The city hosted the 1962 World’s Fair, also known as the Century 21 Exposition, which included construction of what has become the most iconic visual icon of the city, the Space Needle, an observation tower. During the World’s Fair, nearly 20,000 people a day used its elevators.
The aircraft boom ground to an unexpected and savage halt in the late 1960s and early 1970s, a victim of the oil crises, loss of Government contracts, and costs and delays associated with the Boeing 747. Many people left the area to look for work elsewhere. So savage was the downturn that two local real estate agents erected a billboard which read, “Will the last person leaving Seattle Turn out the lights.”
Boeing recovered, of course; and the 747 proved to have been worth all the angst in the long-term; it is now regarded as the most successful commercial aircraft design of all time. While the manufacturing plants remain an integral employer in the region, the corporate headquarters of Boeing were relocated to Chicago in 2001.
But, by then, the city had developed alternative economic pillars. In the 1980s, Microsoft established themselves in the region, and was followed in 1994 by Amazon. Innovative technological startups in the software, biotechnology, and internet fields have sustained the city in slower times since 1990 and led to the occasional economic boom.
The biggest such boom ran from 1990 to 2000, and saw the city grow by 50,000 residents and saw Seattle’s real estate become the most expensive in the US. In 2001, the dot-com bubble burst; many of the Seattle companies had been built on real technologies and not only survived but remained relatively strong, but the explosive growth in the field was over.
In July 2013, Seattle was the fastest-growing major city in the US, remained in the top five for the next 2 years, and then again topped the list in 2016.
Beginning in 2010, and for the next five years, Seattle gained an average of 14,511 residents per year, with the growth strongly skewed toward the center of the city. Unemployment dropped from roughly 9 percent to 3.6 percent. And then another boom started.
This most recent boom is directly attributable to Amazon, which moved its corporate headquarters from north Beacon Hill to South Lake Union (both in Seattle), which involved a historically-epic construction boom which resulted in the completion of almost 10,000 apartments in Seattle in 2017, more than in any previous year and nearly twice as many as were built in 2016.
Nevertheless, the city is now “bursting at the seams”, with over 45,000 households spending more than half their income on housing and at least 2,800 people homeless, and with the country’s sixth-worst rush hour traffic.
Today, Seattle is a major gateway for trade with Asia, and the fourth-largest port in terms of container handling. Because of the indirect impact from imports, Seattle is likely to be one of the cities most strongly impacted by the proposed tariffs on steel and aluminum.
Seattle’s musical history is an enviable one; from 1918 to 1951, nearly two dozen jazz nightclubs existed on Jackson Street, connecting what is now the Chinatown/International district to the CBD. This jazz scene nurtured the early careers of Ray Charles and Quincy Jones to name just two. Seattle’s next claim to musical fame was as the birthplace of Jimi Hendrix, but from 1951 to the 1990s, it was a relatively lean time for the city. Then Grunge and alt-rock exploded into mainstream awareness – Nirvana, Pearl Jam, Soundgarden, Alice In Chains, and the Foo Fighters are all native to the city.
To me, the pattern of that musical legacy is reflective of Seattle as a whole. It plods along, drifting from year to year without making waves – and then emerges from the mists of history to shake the economic foundations of the nation for a while, only to again fall quiet for long enough to be forgotten sufficiently for the “next big thing” to emerge from the region to widespread astonishment. Conditions now seem right for it to again fade from the forefront of cultural and social awareness – for a while.
The Physical Reality
Seattle is farther north than Canadian cities such as Toronto, Ottowa, and Montreal, and lies at roughly the same latitude as Salzburg, Austria. It is further North than Hobart is South, a fact that might surprise many, the consequence of there not being very much of significance between the continental Antarctic landmass and the almost 44°S latitude of Tasmania’s South-East Cape.
Geographically, the city encompasses several noteworthy hills; in fact, like Rome, the city is sometimes said to lie on Seven hills (one of which has been removed by man). The Kitsap and the Olympic peninsulas along with the Olympic mountains lie to the west of Puget Sound, while the Cascade Range and Lake Sammamish lie to the east of Lake Washington.
Much of the immediate region has been extensively landscaped by a number of “mega-projects”. For example, an area north of the central business district contained a steep hill (“Denny Hill”) that was removed to create what is now known as the “Denny Regrade”. This (and other regrades) moved a combined total of more than 35 million cubic yards of earth (almost 27 million cubic meters). Creating Harbor Island involved 7 million cubic yards, while the Ballard Locks project moved 1.6 million, twice that of the Alaskan Way Viaduct replacement tunnel. Straightening the Duwamish River and filling its tide-flats was the largest single project, at nearly 22 million cubic yards.
Seattle is in a major earthquake zone. On February 28, 2001, the magnitude 6.8 Nisqually earthquake did significant architectural damage, especially in the reclaimed land of the Pioneer Square area, but caused only one fatality. Other strong quakes occurred in 1700 (estimated magnitude 9), 1872 (7.3 or 7.4), 1949 (7.1), and 1965 (6.5), which killed three people directly and one more by heart failure.
Climate
“Seattle’s climate is classified as oceanic or temperate marine, with cool, wet winters and mild, relatively dry summers.
“Temperature extremes are moderated by the adjacent Puget Sound, … Pacific Ocean, and Lake Washington. Thus extreme heat waves are rare in the Seattle area, as are very cold temperatures.
“The Seattle area is the most cloudy region of the United States, due in part to frequent storms and lows moving in from the adjacent Pacific Ocean.” – Wikipedia
Despite having a reputation for frequent rain, Seattle receives less precipitation than many other US. cities, but does have many more rainy days when a very light drizzle falls for many days.
In an average year, according to Wikipedia’s sources, 150 days in a typical year receive at least 0.25mm (0.01 inches), more than nearly all US cities east of the Rockies, and it’s cloudy 201 days of the year and partly cloudy on 93 more.
Official weather and climatic data is collected at the Seattle-Tacoma International Airport, located about 19 km (12 mi) south of downtown in the city of SeaTac, which is at a higher elevation, and records more cloudy days and fewer partly cloudy days per year – something to bear in mind when assessing climatic records..
Hot temperature extremes are enhanced by dry, compressed wind from the west slopes of the Cascades, while cold temperatures are generated mainly from the Fraser Valley in British Columbia – which jibes fairly well with what I predicted earlier in the discussion of the region.
You can get a better feel for the variability of the region in terms of climate from the fact that Sequim, 64km from downtown Seattle, has a climate more like that of Los Angeles, roughly 1200 miles to the South, than to the far closer city.
The temperature records clearly show that Summer runs from May to September. November is more like February than it is like October, and March is not all that different from November, at least in terms of temperatures, while April is very reminiscent (statistically) of October.
In practical terms, there’s a 5-month summer (May-Sept), a 5-month winter (Nov-March), and two transitional seasons measured in mere weeks (October and April).
The record highs for the winter season are Nov 23°C (74°F), Dec 19°C (66°F), Jan 19°C (67°F), Feb 21°C (70°F), and March 26°C (78°F).
The more usual winter highs are Nov 10.5°C (50.9°F), Dec 7.6°C (45.7°F), Jan 8.4°C (47.2°F), Feb 9.9°C (49.9°F), and March 12.1°C (53.7°F). At least once in these respective months, however, the temperature will normally climb to Nov 15.9°C (60.7°F), Dec 13.3°C (55.9°F), Jan 13.6°C (56.4°F), Feb 15.7°C (60.3°F), and March 18.9°C (66°F), or more.
Comparing the differences between these values and those of other cities I’ve looked at gives the impression that Seattle is slightly more variable in daily temperature than the usual. That certainly fits with the expectations I raised based on the geography of Puget Sound relative to Seattle.
Typical daily minimums for this time of year are Nov 4.4°C (40°F), Dec 2°C (35.6°F), Jan 2.7°C (36.9°F), Feb 2.7°C (36.9°F), and March 4.1°C (39.3°F). However, it is normal for temperatures to fall, at least once in each respective month, to Nov -1.8°C (28.7°F), Dec -4.4°C (24°F), Jan -3.7°C (25.4°F), Feb -3.4°C (25.9°F), and March -0.4°C (31.3°F). It does sometimes get colder than that; the record lows are Nov -14°C (6°F), Dec -14°C (6°F), Jan -18°C (0°F), Feb -17°C (1°F), and March -12°C (11°F).
These numbers suggest that winter tends to arrive slightly more precipitously than it ends. They also suggest that the winter chills are more consistent for Seattle than for other cities, the occasional icy blast notwithstanding.
28 times in a typical year, the temperatures will drop below freezing. Twice in such a year, temperatures will not rise above the freezing point. It is extremely rare for temperatures to fall below -7°C (20°F), again supporting the impression of more consistent winter lows.
The average window for freezing temperatures is November 16 through March 10, allowing a growing season of 250 days.
Seattle experiences its heaviest rainfall during the period from the start of November to the end of January – roughly half its annual rainfall occurs in these three months. In late fall and early winter, atmospheric rivers (also known as “Pineapple Express” systems), strong frontal systems, and Pacific low pressure systems are common. Many Pineapple Express events follow or occur simultaneously with major arctic troughs in the northwestern United States, often leading to major snow-melt flooding with warm, tropical rains falling on frozen or snow-laden ground. The series of charts below summarize what’s involved in a “Pineapple Express” – from the North of Australia all the way to the North of America by way of Hawaii.
It’s worth noting that the source event (“1” on the first chart) occurs most frequently in our late spring and summer, which corresponds to the American late autumn and winter.
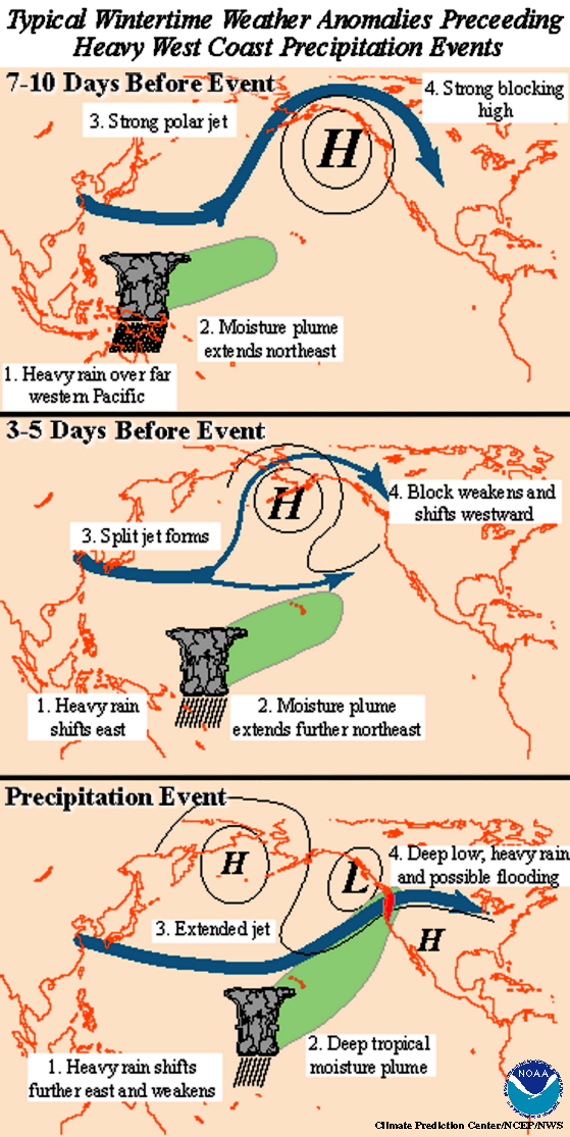
Madden-Julian Oscillation (MJO) effects on North American weather patterns, by Pierre_cb for the US National Oceanic and Atmospheric Administration, edited for greater clarity by Mike
In November, Seattle averages more rainfall than any other US. city of more than 250,000 people; it also ranks highly in winter precipitation. It is simultaneously one of the rainiest major US cities (as measured by the number of days with precipitation) and one of the driest (as measured by the total rainfall, especially during the June-September period (which I have defined as mid-to-late summer).
During El Niño years, little precipitation falls in the Puget Sound area even by the typical standards. Since the region’s water comes from mountain snow packs during the dry summer months, El Niño winters can not only produce substandard skiing but can result in water rationing and a shortage of hydroelectric power the following summer.
Thunderstorms are rare; on average, only seven days a year include a report of thunder. New York City has an average more than 3.5 times this, Kansas City an average more than 7 times that of Seattle, and Fort Myers in Florida, an average more than 13 times this frequency (roughly 2 per week over a year). Most of Seattle’s thunderstorms are relatively mild, a characteristic of the Puget Sound Convergence Zone.
In this Zone, air arriving from the north meets air flowing in from the south. Both streams of air originate over the Pacific Ocean; airflow is split by the Olympic Mountains to Seattle’s west, then reunited to the east. When the air currents meet, they are forced upward, resulting in convection. Thunderstorms caused by this can occur north and south of town, but Seattle itself rarely receives more than occasional thunder and small hail showers.
The Hanukkah Eve Wind Storm in December 2006 is an exception that brought heavy rain and winds gusting up to 111 km/h (69 mph). This event was not caused by the Puget Sound Convergence Zone and was widespread across the Pacific Northwest at the time.
Occasionally, Seattle will experience a more dramatic weather event, usually associated with a “Pineapple Express”. Wikipedia describes one (edited for consistency):
One such event occurred on December 2-4, 2007, when sustained hurricane-force winds and widespread heavy rainfall associated with a strong Pineapple Express event occurred in the greater Puget Sound area and the western parts of Washington and Oregon. Precipitation totals exceeded 350mm (13.8 inches) in some areas with winds topping out at 209 km/h (130 mph) along coastal Oregon. It became the second wettest event in Seattle history when a little over 130 mm (5.1 in) of rain fell on Seattle in a 24-hour period. Lack of adaptation* to the heavy rain contributed to five deaths and widespread flooding and damage.
* I presume they mean “preparation for the heavy rain”.
The average rainfall in Seattle through the winter months is Nov 166.9mm (6.57 inches) over 18.4 days; Dec 135.9mm (5.35 inches) over 17.6 days; Jan 141.5mm (5.57 inches) over 18.2 days; Feb 88.9mm (3.5 inches) over 14.7 days; and March 94.5mm (3.72 inches) over 16.9 days.
Seattle typically receives some snowfall in a year but heavy snow is rare. Average annual snowfall, as measured at SeaTac Airport, is 17.3cm (6.8 inches). Only fifteen falls in a single calendar day of 15cm (6 inches) or more have been recorded since 1948, and only once since February 17, 1990. Much of the city received less snow than was measured at the airport and the southern regions of the city, with Olympia and Chehalis receiving 36-46 cm (14 to 18 inches).
Another moderate snow event occurred from December 12-25, 2008, when over one foot of snow fell and stuck on much of the roads over the two week period because temperatures remained below 0°C (32°F). This caused considerable problems, because these events are so rare that Seattle is not equipped for snow clearance.
The largest documented snowstorm occurred from January 5-9, 1880, with snow drifting to 6 feet (1.8 m) in places by the end of the snow event. But that was almost 140 years ago, long before official records were kept. The heaviest fall officially recorded was 20 inches on January 31, 1950. That month was particularly severe for snow, receiving a total of 57.2 inches (including that single-day fall).
Snowfalls are generally far more moderate, month on month. The averages are Nov 3 cm (1.2 inches) over 0.3 days; Dec 4.3 cm (1.7 inches) over 1.6 days; Jan 3.6 cm (1.4 inches) over 1.3 days; Feb 4.3 cm (1.7 inches) over 0.9 days; and March 2 cm (0.8 inches) over 0.5 days. These are the only months of the year with recorded snowfalls.
The sunshine hours through winter make for grim reading. November has clear skies only 26% of the possible hours on average; December, 20%; January, 25%; February 38%; and March 48%. Even at the height of summer, the sunshine received is only 65% – which is around the LOW mark in some other cities I’ve looked at.
Winter Events
There are a number of local attractions within the Seattle region, operating year-round.
- The Pacific Science Center has a tropical butterfly house, planetarium, hundreds of hands-on science exhibits, two IMAX theaters (night-time only) and one of the world’s largest Laser Dome theaters (ditto). They also have periodic special events.
- The Museum Of Pop Culture (“MoPOP”) sounds like a great place to spend a day. Exhibits are designed to be experienced, not just viewed, and cover everything from Star Trek to Jim Henson by way of David Bowie.
- A multi-course feast, generous libations, and a show that’s part circus and part dinner theater featuring international cirque, comedy and cabaret artists, is the menu for a three-hour evening at Teatro ZinZanni.
- The Bill and Melinda Gates Foundation Discovery Center is at the core of the world’s largest center of private philanthropy, designed to inspire, educate, and empower others to make a difference in the world as well as communicating, through interactive exhibits, the projects of the Gates Foundation.
- Pinball is big in Seattle right now. There’s an annual mid-year Pinball and Arcade Show (11 years and counting) and the world’s largest weekly pinball tournament at Fremont’s Add-a-Ball.
- They might be dying out elsewhere, but record shops are a big thing in Seattle. Bop Street in Ballard carries over half a million LPs and Easy Street in West Seattle is also a center for the resurgent audio medium.
- “Wings Over Washington” is an immersive Virtual Reality aerial tour of some of the most scenic locations in the state. This appears to run all year round. Each “flight” takes about 15 minutes.
- The Seattle Children’s Museum is located in the Seattle Center Armory and features interactive exhibits aimed at “Kids of all ages”.
- The 5th Avenue Theater has produced and presented live musical theater since 1926.
- Seattle regularly holds conventions of various sorts aimed at popular culture, both mainstream and fringe. Anglicon 2017 (Dec 8-10) was a Dr Who convention; Rustycon 35 (Jan 12-14) was a science-fiction/fantasy convention; and the Emerald City Comic Con 2018 (March 1-4) was about comics and pop culture in general, to name just three. There’s another for paranormal investigators (the Port Gamble Ghost Conference), and one for small publishers and… look, there are lots of them, okay?
- The first Thursday of every month, three museums offer free entrance to their regular exhibits: the Burke Museum of Natural History and Culture at the U.W.; the Museum of History & Industry at South Lake Union; and the Seattle Art Museum downtown, which also permits entrance to any special exhibition for half price on these Free Thursdays.
November
But these only scratch the surface. Seattle is one of those places where there is always something going on. The following are selected highlights of the November events calendar (trust me, I left dozens more off the list):
- The month starts back in mid-October with the Earshot Jazz Festival which concludes after almost 3 weeks and more than 50 live concerts on November 4th (2018). Timing in other years will probably vary.
- Seattle Restaurant Week runs for eight days at the start of November (and again in April) – except Fridays and Saturdays. 165 restaurants in the Seattle area offer three-course meals at discounted prices. All participants offer Dinners, some also offer discounted Lunches.
- On a November date to be confirmed (it was Nov 4 in 2017), the Day Of The Dead Festival includes a procession of Aztec dancers, performances by singers and folk dancers, the dedication of an altar, face painting, and Mexican snacks for sale.
- Not to be confused with the Emerald City Comic Con, the Jet City Comic Show at the Tacoma Convention Center brings in an extra dose of comics and pop culture.
- At about the same time, “America’s Largest Antique & Collectible Show”, a quarterly event, brings 400 vendors selling everything from furniture to slot machines and memorabilia. Note that this is a traveling “show” that has made over 220 appearances over the last 32 years in different locations, mostly in the northwest, but some as far south as Reno, Nevada.
- The Seattle Winter Ciderfest occurs early in the month. Tasting the “Fall and winter ciders from the Northwest’s best producers” plus local beer, wine, soda, and vendors representing ski resorts, spas, and music festivals come together for one evening. Ages 21+ only.
- The Veterans Day Parade and Observance (Nov 10, 2018) in Auburn, 26 miles south of the Seattle CBD, is one of the largest in America, with veterans’ units, military vehicles, motorcycles, 25 marching bands, and floats, plus related events. Note that it’s actually scheduled for the day BEFORE Veterans Day.
- Also on Nov 10 is the Tacoma Beer Festival, featuring “150 Halloween-themed and seasonal craft beers from 34 breweries”, plus food for sale. Ages 21+, costumes welcome.
- And starting at the same time, but extending an extra day, is Northwest Chocolate Festival brings 80 purveyors of chocolate delights to satisfy the most ardent chocoholic.
- Veterans Day is one of the Free Entrance Days at all National Parks and Washington State Parks. There are more than 140 of the latter to choose from.
- Sometime during the month (no date has yet been confirmed), the Seattle International Auto Show will display 400 of the latest cars and trucks.
- Starting in late November and running through to the New Year’s Eve celebrations at the Space Needle is the Seattle Center’s Winterfest. Activities that are designed to be free or highly affordable, fun, and uplifting, take place over five weeks in a variety of venues – everything from ice carving, live performances, ice rinks, Dickensian carolers, a comedy show, a dance party, student showcases, and the Winter Train & Village, a turn-of-the-(19th)-century village and train.
- The day after Thanksgiving, the Christmas Ship Festival gets underway, and continues until December 23. The Spirit Of Seattle is decorated with twinkly lights and sails to 65 different waterfronts in Puget Sound while an on-board choir serenades passengers and shore-dwellers. This has been a regional tradition since 1949. The Red Tricycle web-page on the Festival has some great photos but they are copyright Argosy Cruises, so you’ll have to go there to look at them (the one about half-way down the page is my favorite).
- Starting in mid-November, Swanson’s Nursery (a prime source of Christmas Trees) transforms into a “Winter Wonderland” in what it called the Reindeer Festival. The display, which includes a model train village and Santa’s Reindeer, remains open to the public until Christmas Eve.
- From around Thanksgiving (in 2017 it was from Nov 21) until Jan 1, Seattle showcases its annual Gingerbread Village. Seattle takes this very seriously; architectural firms, master builders, and Sheraton Seattle culinary teams create a “meticulously planned candy wonderland”. The 2017 exhibit recreated elements of Seattle’s past and imagined future in candy form, “from skyscrapers to underground tunnels”. This is more installation art than the domestic treat that may have initially come to mind.
- From a month before Christmas through until the end of the year, the Bellevue Botanical Garden offers the “Garden d’Lights”, in which more than half-a-million sparkling lights are formed into “whimsical shapes of plants, flowers, birds, animals, and cascading waterfalls” within the Garden’s scenic surrounds.
- Not to be outdone, the Woodland Park Zoo presents, from Thanksgiving+1 day through to Jan 1, their annual “WildLights” exhibit, which uses 500,000 LEDs to create luminous animal-themed designs and put the zoo’s nocturnal animals in a new light. Other attractions are an indoor snowball fight, real reindeer, carolers, and a holiday beer garden.
- And, at the same time, the Point Defiance Zoo and Aquarium in Tacoma (34 miles from Downtown Seattle) creates hammerhead sharks, sea turtles, carnivorous plants and their insect prey, a 30-foot-wide underwater landscape, a polar bear family, and a giant Pacific octopus from lights.
- And yet another light-themed event that starts at the same time, but runs until mid-January, is the Lantern Light Festival, a 2000-year-old Chinese tradition in which lanterns of various shapes, sizes, and colors are set aglow. The chinese-dragon lantern is quite spectacular (I’d like to have included the image but it appears to be copyright, so click on the link to see it).
- The Seattle Marathon and Half-marathon will be held on November 25th in 2018. More than 15,000 people participate.
- Late in November through to early in December there is a Victorian Country Christmas market with 500 booths with vendors in Victorian costumes selling art, jewelry, decorations, clothing, and toys.
You see what I mean?
December
Not only do several of the above continue for various lengths into December, but there are even more events on the Christmas Month’s schedule. Below is an even more restricted set of highlights:
- The Leavenworth Christmas Lighting Festival (aka the Leavenworth Festhalle) commences Dec 1 and continues every weekend through to the last Sunday before Christmas Eve, transforming the Bavarian town into a village of holiday-themed lights, and featuring live music, street performances, roasted chestnuts, a traditional Gluhwein Tent selling hot spiced wine and cider, and more. Admission is free. While Leavenworth is almost 135 miles from Seattle, this is nevertheless a popular place to visit, reachable by train, bus, or car. Most of the trip takes place within the Wenatchee National Forest, ensuring plenty of alpine scenery.
- Also starting the festive season with an exotic splash is Jule Fest, a Scandinavian Christmas bazaar of arts and crafts, folk dancing, Vikings, a Christmas tree lighting, Lucia bride, bonfire, and Santa Claus.
- The Seattle Art Museum runs different public tours throughout the year. Regular involvement by an
eccentric?opinionated local art community – visual artists, dancers, curators, critics, and more – mean that these are constantly changing, and the Museum is a place to explore repeatedly through the year. But the highlight of the year is the annual SAM Lights display, a free illuminated event in the associated Olympic Sculpture Park (which is usually only open during daylight hours) that includes hands-on public art-making, music, hot drinks and sweet snacks, and of course, the light display. In 2017, this event was Dec 14, a Thursday, suggesting that the date is fixed. - Speaking of the local arts community, Nov 30 and Dec 1-2 sees the Seattle Sampling Artists’ Studio Tour – 24 artists at 8 studios who make clothing, jewelry, glass, ceramics, prints, and more offering their wares for public purchase.
- Dec 9 is the scheduled date for the Jingle Bell Run (5k, or 1 mile distances) and the kid’s run (1 km). Participants are encouraged to wear a costume or Christmas bells, walkers are welcome, but there is a fee for dogs.
- New Year’s Eve is spectacular at the Space Needle, which is transformed into a fireworks platform that has to be seen to be believed. The city closes the streets in front of the Space Needle so there is ample room to find an unobstructed view.
January
Things quieten down – a little – in January. I only count 42 events currently scheduled for January 2019. Of course, that’s a long way away, leaving plenty of time for more event to be announced…
- The Resolution Run 5K and Polar Bear Dive is a 5K fun-run on January 1 and includes an optional dip in the cold waters of Lake Washington, awards, snacks, and a beer garden at Magnuson Park.
- And, just a mile north of those who want to work up a sweat first, the annual Polar Bear Plunge attracts 1000+ people a year to wade into Lake Washington, and even more to watch them do it. Costumes are encouraged.
- In Tacoma, and starting Dec 31, there is a 2-day Model Train Festival.
- The provocatively-named Worst Day Of The Year Run is a 5K/10K winter run with a costume contest, indoor finish line party and a beer garden. The 2019 version will be the fifth event in what is rapidly becoming established as an annual tradition. The run’s menacing name derives from the sister event that inspired it, the Worst Day Of The Year Ride, a cycling event that started in 2000 in Portland. The ride, in turn, was named in honor of Oregon’s coldest and wettest day in history: February 8th. In 1933 on that date, Ukiah, Oregon enjoyed balmy temperatures of -54 degrees, and in 1966, the coastal range was all but swimming after 26′ of rain in just 4 days.
- Once the Christmas Lighting Festival at Leavenworth has run its course for the year, the township takes a couple of weeks to reinvent itself for the Bavarian Icefest. A one-weekend-a-year event which transforms the town with snow sculptures, a snowmobile sled-pull, live ice carving, and other cold-oriented activities.
- And, two weeks after that (are you sensing a theme, here?) they host the Timbrrr! Winter Music Festival which throws skiing, snowboarding, a hot-toddy garden, wine tastings, and festival-branded flannel shirts together with numerous local and national acts of styles ranging from indie rock to hip-hop.
- Martin Luther King day (Jan 21 in 2019) is another free entrance day to state and national parks. There is also a workshop at Garfield High School followed by a rally, a two-mile march, and a second rally to celebrate the day, amongst more conventional commemorations.
February
The tranquility is not a function of the colder weather; come February, and the schedule has regrown to November-level event levels, despite the shortness of the month. The list below has been ruthlessly pruned:
- This entire month is designated “Seattle Museum Month” in which a huge diversity of museums in the Seattle area put on special exhibitions and drop their prices to half the usual admission fee. Everything from the Museum Of Flight to the Pacific Science Museum to the Museum of Pop Culture take part.
- Early February will showcase the Seattle Boat Show, which promises 1000 boats and watercraft on display plus 200 boating seminars. Attendees can also visit boats in the water at Bell Harbor Marina & South Lake Union. It’s possible that the event opening will be brought forwards into January.
- America’s Largest Antique & Collectible Show is back.
- The official start of Spring has become, over the last 25+ years, the traditional time for the annual Northwest Flower & Garden Festival, attracting gardening enthusiasts from all over the Northwest of the USA. Tickets also grant access to a vintage garden market, educational seminars, a gourmet marketplace of craft food and beverages and more. The Festival runs from Feb 7-11, plus an opening-night party to support the Washington Park Arboretum.
- Of course, Valentine’s Day events abound. Options include everything from Symphony Concerts to Burlesque Shows (more than one of each!)
- New Orleans might be around 2500 miles away as the crow flies, but the ‘any excuse for a party’ mentality won’t let anything so trivial as that get in the way. The Mardi Gras Masquerade Party Cruise includes “Creole and New Orleans inspired appetizers and desserts,” a masquerade mask, beads, a drink ticket, and three hours of scenic views of Lake Union and Lake Washington. For age 21+, of course.
- Any city that celebrates the Lantern Lights Festival (see November, above) is likely to make a big deal about the Chinese New Year. So it is no surprise that one of the biggest annual parties in Seattle is the Lunar New Year in Chinatown. Of course, the date varies from year to year, but is generally in mid-to-late-February. In fact, the region celebrates the event twice in 2019 – once on the 11th and again on the 24th.
- Later in the month, the Seattle Food and Wine Experience is a three-day festival of gastronomy with an emphasis on local produce. Multiple local gastropubs and taverns, winemakers, and brewers come together to produce a succession of themed culinary delights at a series of locations.
- And, at about the same time, the annual Wintergrass Festival is underway at the Hyatt Regency Bellevue. As you might suspect from the name, this is a Winter Bluegrass festival, which this year ran for 4 days.
March
March is when the social calendar starts to get busy. There are more events that either have taken or will take place in the course of this month than there were in November, by a considerable margin.
- One of the big events of the year is the Emerald City Comic Con; in 2017, more than 91,000 fans attended, along with hundreds of guests from television, movies, and comics. The 2018 version was from March 1-4. Next year, it will be mid-month. Helping it grow each year is the inclusion of add-on side-events open to the general public as opposed to being restricted to registered attendees.
- There’s a Sewing and Stitchery Expo for the same four days.
- One of those side events is the Night of Board Gaming for Good on Top of the World which, for $69, includes a buffet dinner, two $10 vouchers for the game store, and all of the games you can play, with views from the top floor of Columbia Tower, all to support charity.
- March 2-4 is the Polar Science Weekend at the Pacific Science Center.
- Carnival for a Cause on March 3 includes two drink tickets, appetizers, and dancing at a number of locations hosted by 1927 events and is a Masquerade cocktail party.
- Also on March 3 are several celebrations of the Indian festival of Holi, when colored powder flies. Younger Children (age 12- at one, age 15- at the other) are free at two of the events, another is adults 21+ only.
- The Seattle Bike Show is March 3-4, and entry is free for children 12 and younger. Tickets also give access to the Golf and Travel Show and the Outdoor Gear and Adventure Expo, both at the same location at the same time.
- In a sort of prelude to St Patrick’s Day, the Shamrock Wine & Beer Walk on March 10 includes 10 tastes from Washington wineries & breweries in the shops at Country Village in Bothell. Wear some green, and bring a glass. Age 21+, ID required.
- The Seattle Kennel Dog Show on March 10-11 attracts 11,000 spectators and 2,000 dogs.
- St Patrick’s day commences the previous afternoon (because it can) with the Landing Of St. Patrick at 5:30PM (at South Lake Union) and the Green Stripe Laying starting at 7PM which marks the parade route along 4th Avenue. Both are free events.
- St Patrick’s day proper starts officially at 12:20 PM with the raising of the Irish Flag at a ceremony in front of the King County Administration Building. The Mayor of Seattle and various parade dignitaries will be in attendance and the Irish and American national anthems will be played. The Parade itself begins approximately 10 minutes later and features Irish bands, pipers, dancers, and 2,000 marchers. Several other events also mark the day, some of which are listed separately below.
- The St Patrick’s Day Dash is a 5K fun-run (wear green or a costume), and then head for the giant beer garden if your over 21. The Leprechaun Lap is a 1K dash for kids aged 10 and younger.
- There are two other fun runs on the day. The Kirkland Shamrock Run (5km) and kids’ race ends with a party at the Wilde Rover, and welcomes walkers. The St Paddy’s Day Run in Tacoma is a morning 5K, 10K, half-marathon, and kid’s 1K run.
- The St Paddy’s Day Cruise includes one free drink, an appetizer and dessert buffet, food for sale, and three hours of scenic views of Lake Union and Lake Washington. Ages 21+.
- The State’s oldest and largest Coin Show is at the annual convention of the Pacific Northwest Numismatic Association, March 16-18.
- At the same time, the Quilters Anonymous Annual Quilt Show takes place at the Evergreen State Fairgrounds in Monroe, in the greater city’s north-eastern fringes.
- March 17-18 is the Spring Book Sale by Friends Of The Seattle Public Library and features 100,000 titles starting at $1.
- You might expect everyone to be tired out, but no – the day after St Patrick’s Day sees yet another run, the Mercer Island Half Marathon, which also includes a 10K run, a 5K run/walk, and a half-mile Kids dash.
- Billed as the world’s largest comedy/variety festival, the Moisture Festival has 40 shows at Hale’s Palladium, Broadway Performance Hall, and Teatro ZinZanni at 3 & 7:30 pm. for all ages; plus burlesque and late-night shows for age 18+.
- On March 23, Boots, Barrels and Brews tickets include six beer or wine-tasting tickets, appetizers, a live country band, and line-dancing lessons. Age 21+.
- Starting on the same day, the 3-day Victorian Heritage Festival has a Friday evening pub crawl, a Saturday Victorian fashion show and Victorian Ball, and weekend teas plus weekend tours of historic buildings in Port Townsend.
- Easter comes early to Seattle this year; while the big day is of course April 1, events start on March 23 and continue daily.
- Norwescon is a literary sci-fi and fantasy convention starting March 29 and running through April 1. Two hundred panelists, vendors, events, and 24-hour game-playing. It describes itself as The Pacific Northwest’s Premier Science-Fiction and Fantasy Convention, and is one of the largest regional conventions of its type in the US. The 2018 edition will be the 41st. Attendance numbers haven’t been provided for a few years but in 2013, approx 3200 attended.
- The day after Norwescon starts, it is joined by Sakura-Con, an Anime festival and rival. Traditionally held over Easter weekend, is the largest anime convention in the Northwest and is the 8th largest North American anime convention as of 2017. Last year, 25,000 attended. 2018 is the 21st anniversary of the original event.
My best guess is that the listings above represents at most a tenth of the total events hosted by Seattle and Region over that five month period. Typical of the items that didn’t make the cut are the Seattle Scotch & Beer Fest and the Grilled Cheese Festival. If you want to experience the jaw-dropping totality, consult the events12 links below.
It strikes me, as I complete this essay on the city, that Grunge Music is the perfect metaphor for the City that birthed it. Rarely receiving enough rain to do more than spread the grit around, and full of dark and gloomy looks, it nevertheless captures the vitality and life of a city in which any excuse is good enough for a gathering. They even have a Mussel festival and a Hairstyle Show, two more March events that didn’t make the cut – but, between them, they represent the sense of fun and activity that seeps out of the list of events above!
Primary Sources:
- Wikipedia’s Seattle page;
- Wikipedia’s Puget Sound page;
- Clipper Vacations Magazine’s web page, 25 Things To Do In Seattle This Winter by Katie Schlossberg;
- The Seattle Center’s web page for Winterfest 2017;
- The Seattle Art Musuem’s home page and SAM Lights web page;
- The home page of the Bill and Melinda Gates Foundation Discovery Center;
- The home page of the Emerald City Comic Con;
- The Best Festivals in Seattle: Winter 2017/2018 by Elaina Friedman, Kim Selling and Joule Zelman for The Stranger;
- Events 12 Seattle’s pages for
- Worst Day Of The Year Run’s Facebook page.

San Francisco History Montage Notes & Credits:
- San Francisco Location Map (also showing Los Angeles).
- San Francisco Bay Area map by Mliu92 using data from Open Street Map, CC-BY-SA 2.0.
- Prospector by Tony Oliver based on a Public Domain photograph by LC McClure, created for a history guide published by the New Mexico Santa Fe Trail National Scenic Byway Alliance, License CC-BY-SA 2.0, image from Flikr.
- Gold on quartz from California, USA. (public display, Leadville Mining Museum, Leadville, Colorado, USA) image by James St John, License CC-BY-SA 2.0, image from Flikr via Wikipedia Commons – although this was mined, the appearance of gold on its surface is typical of the gold panned by the early prospectors.
- California Gold Rush Handbill from 1849, public domain image.
- San Francisco Harbor at Yerba Buena Cove in 1850 or 1851, Public Domain Image first published prior to Jan 1 1923. Source: US Library Of Congress via Wikipedia Commons. During the gold rush, so many vessels were crowded into the harbor that it routinely took 2-3 days before unloading commenced.
- Miner Prospecting via wpclipart.com, colorized version of a lithograph by August Wenderoth created in 1852, original image © the Smithsonian American Art Museum, object 1983.78.1.
- Native gold in quartz – Eagles Nest Mine, Placer County, California, USA, on public display Museum für Naturkunde, Berlin. To make the gold crystals visible, the quartz was partially etched away. Image © Raimond Spekking / CC BY-SA 4.0 (via Wikimedia Commons). This is typical of mined gold from the California Goldfields – a chunk of white quartz with delicate veins of gold running through it.
- Except from Panorama of San Francisco by Eadweard Muybridge, April 1878. This was a rephotographing of a panorama photographed and published the previous year. The photographic plates used measured 18×22 inches; the finished panorama measured more than 17 feet and was published as an album, and is perhaps the best record of the appearance of the city prior to the events of 1906. The panorama (public domain image) was Photographed and compiled by the conservator, Gawain Weaver and the image may not be copyright-free in your jurisdiction, refer this page. This excerpt captures just one of the panels and should be regarded as a derivative work based on an image not protected by copyright within the USA, and no copyright is asserted that does not derive specifically from the source image.
- San Francisco Fire 18 April 1906 as viewed from the St Francis Hotel, photo by Pillsbury Picture Co, held by the US Library Of Congress Reproduction Number LC-USZ62-130410. This image, obtained from Wikipedia, is in the public domain within the US due to expiration of the copyright deemed to apply, but that might not be the case in other jurisdictions, refer this page.
- Closeup excerpt from the previous photograph, all notations, copyrights, and credits are as shown above.
21. Winter In San Francisco
Forty-one or forty-two years ago, my family (including a Grandmother and an Aunt) embarked on a three-week tour of the US. This was the trip that resulted in the loss of luggage at Las Vegas, mentioned in the entry detailing the Nevada city. From there, we traveled to San Francisco.
It’s a city that holds mixed memories for me, as a result. I was impressed by the public transport system – one ticket lasted all day, no matter how many times one alighted and rejoined the cable cars – but there wasn’t a whole lot of interest to the young teenager that I was at the time.
It was bitterly cold (in comparison with Las Vegas, bearing in mind that the clothing I was wearing was quite inappropriate for the climate), and spending money was in relatively short supply (I think some of that had been lost in the missing luggage). So we didn’t do much and didn’t go very far. One round trip on the cable-cars, one trip – it might not even have been a round-trip – on the BART, which was new and ran completely under the Bay, one trip to Lombard St, and the Mirin Headlands (to see the Golden Gate Bridge).
But we did pick up in Chinatown what still abides in my memory as the most comfortable jeans I’ve ever worn – stonewashed denim, pre-softened – and an orange-colored Hawaii-print sloppy joe that I still remember fondly, and that was possibly the softest shirt that I’ve ever owned.
Still, at the time, San Francisco was a disappointment. If I were ever to return, I think I would find a lot more to be of interest. Because there is a lot there to be interested in.
The Location
Let’s start with something astonishing. While almost everyone has heard of both Los Angeles and San Francisco, altogether too many people couldn’t tell you which one was more Northerly of the two. I once saw a survey of Americans that said that this was true of 60% of the US population (excluding Californians) – it was in the late 80s, I think – and that 25% of respondents thought that the two cities were less than 100 miles apart.
San Francisco is about 40% of the way down the California coast. Los Angeles is roughly 80% of the way down that coast. There’s a difference of about 610 km (380 miles), and that’s more than enough to make a significant climatic difference between the locations.
Which is a distinction that most people are aware of, but they never seem to think about the geographic implications.
San Francisco is the 13th-largest city in the US in terms of population and the fifth most densely-populated US County (the two terms are virtually interchangeable).
The History
San Francisco was founded as a Spanish colony on June 29, 1776 (if the founders has any sense of future history, they might have waited another 5 days…)
In 1821, the area became part of Mexico during the Mexican War Of Independence. California was then claimed on behalf of the US by Commodore John D. Sloat on July 7, 1846, during the Mexican-American War, and what was to be renamed San Francisco was claimed by Captain John B. Montgomery two days later. On January 30, the name change took effect, and Mexico officially ceded the territory to the US at the conclusion of the conflict in 1848.
Despite being an attractive location for a port and naval base, San Francisco was still a small settlement with inhospitable geography, numbering only 1,000 residents. That, however, was about to change…
Gold Rush of 1849 and the Barbary Coast
On January 24 of 1848, gold was found at Sutter’s Mill in Coloma, California (58 km [36 miles] northeast of Sacramento, which is itself 142 km [88 miles] northeast of San Francisco).
Sutter had plans for an agricultural empire and attempted to suppress the discovery because he feared his plans would be disrupted if it became known, but rumors soon started to spread and were confirmed in March by San Francisco newspaper publisher Samuel Brannon. Brannon quickly set up a store to sell prospecting supplies and then strode through the streets of the city holding aloft a vial of gold, shouting about the discovery.
It took five months for the story to be picked up by a major East Coast newspaper, the New York Herald, who published the discovery on August 19th. These days, people have the erroneous impression that the news spread like wildfire, not realizing that the coasts were not linked by telegraph until 1861 and by rail until 1869. The tyranny of distance was very real in those days. While the section “Distance From News” in my 2017 article The Influence Of Distance Part 3: Far (The first half) dealt with remote communities being separated from the news of the political and social centers, the problem cuts both ways, and those centers are just as separated from events in remote corners.
Almost four months later, in December, President James Polk confirmed the discovery in an address to Congress, telling them – and the world – “The accounts of abundance of gold are of such an extraordinary character as would scarcely command belief were they not corroborated by the authentic reports of officers in the public service.”
It was this confirmation, and the news of it, that really ignited Gold Fever in the rest of the world. By then, California had been living with the discovery for almost ten months.
When the residents of San Francisco learned of the discovery, courtesy of the opportunistic Samuel Brannon, the then-tiny settlement became a ghost town of abandoned ships and businesses. It was only when waves of immigrants began arriving – the earliest as a result of the New York Herald story – that the population began to swell. By then, Sutter had (as he feared) been ruined; his workers had abandoned their employment in search of gold, and squatters had taken over his land, stealing his crops and rustling his cattle.
The boom began in earnest in 1949, hence the popular nickname for the opportunistic prospectors, “49ers”.
Throughout the year, people around the United States (mostly men) borrowed money, mortgaged their property, or spent their life savings to make the arduous journey to California. They abandoned wives and children, families and deserted responsibilities.
The first waves came by ship, and were also known as Argonauts; from the East Coast, a sailing voyage around the tip of South America would take five to eight months, and the alternative was to sail to the Atlantic side of the Isthmus of Panama, take canoes and mules for a week through the jungle, and then on the Pacific side, wait for a ship sailing for San Francisco. There was also a route across Mexico starting at Veracruz. But many gold-seekers – now estimated to be half – took the overland route across the continental United States, particularly along the California Trail, and these are the ones that are best remembered in modern times.
Each of these routes carried deadly risks, but I could not find any reliable estimates of how many perished en route. It may have been as little as 1%, or as many as 1 in six. Hundreds are known to have died en route, but the toll may have been much higher.
“The people who went to California by the the tens of thousands were greenhorns — city folks. They didn’t have a callus on their hand, had never fired a rifle, had never followed a plow, had never rode a horse, didn’t know up from down in terms of the wilderness world, the frontier life. And they weren’t interested in it.” – JS Holliday, author of “The World Rushed In”, quoted by Genealogy Trails.
The first groups to arrive were from Oregon, the Sandwich Islands (now Hawaii), Mexico, Chile, Peru and even China. Immigrants from these regions were arriving even before the East Coast knew there was anything to get excited about.
The gold rush brought rapid growth to San Francisco, as eager fortune-hunters from all over the world rushed to the region. By December 1849, the population of the city was 25,000. California boomed equally; estimated at this time to be 100,000 (non-natives only), up from 20,000 a year earlier, and around 800 in March 1848. By the mid 1850s, it would be 300,000, or one in 90 US Citizens. By 1852, more than 25,000 immigrants from China alone had arrived in America.
The promise of fabulous riches was so strong that crews on arriving vessels deserted and rushed off to the gold fields, leaving behind a forest of masts in San Francisco harbor. Approximately 500 ships were abandoned, some of which were then used as storehouses, saloons, and hotels, but many were left to rot and some were sunk to establish title to the underwater lot.
To provide for the needs of the ’49ers, gold mining towns had sprung up all over the region, complete with shops, saloons, brothels and other businesses. Most of these were operated by those who had come early and learned the brutal reality – even with gold abundant (a relative term), 9 prospectors in 10 found nothing. Many got out of the melee and began to open businesses catering to newly arrived prospectors.
“In fact, some of America’s greatest industrialists got their start in the Gold Rush.
“Phillp Armour, who would later found a meatpacking empire in Chicago, made a fortune operating the sluices that controlled the flow of water into the rivers being mined.
“Before John Studebaker built one of America’s great automobile fortunes, he manufactured wheelbarrows for Gold Rush miners.
“And two entrepreneurial bankers named Henry Wells and William Fargo moved west to open an office in San Francisco, an enterprise that soon grew to become one of America’s premier banking institutions.
“One of the biggest mercantile success stories was that of Levi Strauss. A German-born tailor, Strauss arrived in San Francisco in 1850 with plans to open a store selling canvas tarps and wagon coverings to the miners. After hearing that sturdy work pants – ones that could withstand the punishing 16-hour days regularly put in by miners – were more in demand, he shifted gears, opening a store in downtown San Francisco that would eventually become a manufacturing empire, producing Levi’s denim jeans.”
“Most of the men who flocked to northern California arrived with little more than the clothes on their backs. Once there, they needed to buy food, goods and supplies, which San Francisco’s merchants were all too willing to provide – for a cost. Stuck in a remote region, far from home, many prospectors coughed up most of their hard-earned money for the most basic supplies. At the height of the boom in 1849, prospectors could expect prices sure to cause sticker shock: A single egg could cost the equivalent of $25 in today’s money, coffee went for more than $100 per pound and replacing a pair of worn out boots could set you back more than $2,500.” – History.com
Labor was in such short supply, and hence commanded such high wages, that it was routine for laundry to be shipped to Hawaii for washing – for those who could afford to have laundry done at all.
California was granted statehood in 1850. Silver finds, including the Comstock Lode in Nevada in 1859, further drove rapid population growth.
The overcrowded chaos of the mining camps and towns grew ever more lawless, including rampant banditry, gambling, prostitution and violence.
“As the amount of available gold began to dwindle, miners increasingly fought one another for profits and anti-immigrant tensions soared. The government got into the action too. In 1850 California’s legislature passed a Foreign Miner’s tax, which levied a monthly fee of $20 on non-citizens, the equivalent of more than $500 in today’s money. That bill was eventually repealed, but was replaced with another in 1852 that expressly singled out Chinese miners, charging them $2 ($80 today) a month. Violence against foreign miners increased as well, and beatings, rapes and even murders became commonplace. However no ethnic group suffered more than California’s Native Americans. Before the Gold Rush, its native population numbered roughly 300,000. Within 20 years, more than 100,000 would be dead. Most died from disease or mining-related accidents, but more than 4,000 were murdered by enraged miners.” – History.com
San Francisco was not spared. Fortune hunters streamed through the city, and lawlessness was rife; the Barbary Coast section of the town became notorious as a haven for criminals, prostitution, and gambling.
By 1851, surface gold had largely disappeared, though fortune-seekers continued to arrive. Striking it rich had always been difficult and dangerous, requiring as much good luck as skill, perseverance, and a near-obsessive work ethic. The average daily take for independent miners working with pick and shovel had been declining sharply from what it had been in 1848. As gold became more and more difficult to reach, the growing industrialization of mining drove more and more miners from independence into wage labor.
In that year, the San Francisco harbor was extended out into the bay by wharves while buildings were erected on piles among the ships, and by 1870 the entire Yerba Buena Cove had been filled to create new land; buried ships are occasionally exposed when foundations for new structures are dug.
Gold Mining peaked in 1852, though it would continue throughout the decade.
The Gold Rush would have had an even more profound impact on the population of California, including San Francisco, had not a great number of those seeking wealth departed for the Alaskan Goldfields starting in 1896.
As the funnel through which the riches of the goldfields poured, San Francisco prospered throughout the Gold Rush.
“Development of the Port of San Francisco and the establishment in 1869 of overland access to the eastern US. rail system via the newly completed Pacific Railroad (the construction of which the city only reluctantly helped support) helped make the Bay Area a center for trade. Catering to the needs and tastes of the growing population, Levi Strauss opened a dry goods business and Domingo Ghirardelli began manufacturing chocolate. Immigrant laborers made the city a polyglot culture, with Chinese Railroad Workers, drawn to “Old Gold Mountain”, creating the city’s Chinatown quarter. – Wikipedia
It’s not entirely untrue to say that this boom was the making of the city. Through the 1870s, 1880s, and 1890s, a sea of Victorian houses began to take shape, and civic leaders campaigned for a spacious public park which eventually was realized as Golden Gate Park. San Franciscans built schools, churches, theaters, and all the other infrastructure of civic life, while the Presidio developed into arguably the most important American military installation on the Pacific coast.
By 1890, San Francisco’s population was approaching 300,000, and the city was the 8th largest in the US. By the close of the century, San Francisco had established a unique character as possessing a flamboyant style, stately hotels, ostentatious mansions, and a thriving arts scene. The city acquired the nickname “The Paris Of The West”.
Plague
But the new century was not to be kind to the burgeoning metropolis. The first continental North American plague epidemic struck the city in 1900.
A ship from Hong Kong in 1899 had two cases of Bubonic plague on board. Because of this, although no passengers were ill when the ship reached San Francisco, it was to be quarantined on Angel Island. When the boat was searched, 11 stowaways were found – the next day two were missing. Their bodies were later found in the Bay, and autopsy showed they contained plague bacilli.
It is believed that rats from the ship escaped into the city, and were the source of the outbreak in Chinatown 9 months later. Health authorities immediately recognized the danger posed by the situation, but for more than two years, would be obstructed by Henry Gage, the Governor of California, who denied there was a problem. Gage was motivated by the wish to keep the reputations of San Francisco and California clean and to prevent the loss of revenue from trade stopped by quarantine. The failure to act quickly is believed by many to have allowed the disease to establish itself among local animal populations.
“Anti-Chinese feeling ran strong in the city then, and the first step taken was to quarantine Chinatown. The Chinese objected, and so did the business community. Not because they wanted to protect the rights of the Chinese, but it was bad for business to have people thinking there was plague in their city or state.
“The quarantine was lifted and health officials began to run house-to-house inspections of Chinatown. People resisted, hiding their dead and locking their doors. But two more plague victims turned up.
“The city Board of Health officially announced that plague was present in the city. The governor refused to believe it or to do anything to help in the anti-plague effort.
“The Surgeon General got permission from President McKinley to pass anti-plague regulations. Others still denied the existence of plague, although more and more states in the country were stopping trade with California.
“Commissions and boards formed, fought with the governor, and were disbanded, underfunded, and reformed. Meanwhile, more plague cases were found.” – PBS
City leaders were not above taking advantage of the situation when opportunities presented themselves. In the mistaken belief that interred remains were one source of the disease (for which there was little evidence), burials were banned within the city. Cemeteries were moved to the undeveloped area just south of the city limit, now the town of Colma, California, releasing extremely valuable land within the city limits. (In 1912 (with legal fights extending until 1942), the last remaining cemeteries in the city were evicted to Colma, where the dead now outnumber the living by more than a thousand to one). Less than a handful of exceptions were granted.
Federal authorities slowly built up incontrovertible proof of the problem, and this undermined Gage’s credibility to such an extent that despite the city being in the grip of machine politics, he lost the 1902 Gubernatorial election. His replacement quietly implemented medical solutions and by 1904 the epidemic was stopped with 119 dead of 121 identified cases.
The Great Fire of 1906
“At 5:12 am on April 18, 1906, a major earthquake struck San Francisco and northern California. As buildings collapsed from the shaking, ruptured gas lines ignited fires that spread across the city and burned out of control for several days. With water mains out of service, the Presidio Artillery Corps attempted to contain the inferno by dynamiting blocks of buildings to create firebreaks.
“More than three-quarters of the city was destroyed by the earthquake/fire combination, including almost the entirety of the downtown city center. Official estimates at the time put the death toll at 498, but modern estimates place the true number in the thousands.
“More than half of the city’s population of 400,000 was left homeless. Refugees created a diaspora, settling temporarily in makeshift tent villages in Golden Gate Park, the Presidio, on the beaches, and elsewhere. Many fled permanently to the East Bay.” – Wikipedia
Reconstruction
“Rebuilding was rapid and performed on a grand scale. Rejecting calls to completely remake the street grid, San Franciscans opted for speed. Amadeo Giannini’s Bank of Italy, later to become Bank of America, provided loans for many of those whose livelihoods had been devastated.
“The earthquake hastened development of western neighborhoods that survived the fire, including Pacific Heights, where many of the city’s wealthy rebuilt their homes. In turn, the destroyed mansions of Nob Hill became grand hotels. City Hall was reopened in 1915.” – Wikipedia
The area destroyed included the Chinatown district. While reconstruction was underway, a second outbreak of Bubonic Plague occurred, this time spread generally over the city, including cases across the bay in Oakland. It seems likely that plague-carrying rats had spread out unchecked following the fire, searching for food.
This time, the official response was rapid and decisive. Between 1907 and 1911, $2 million was spent on killing as many rats as possible in the city – more than $50 million in modern currency.
In 1907, Mayor EE Schmitz was found guilty of extortion and the office of mayor declared vacant. Schmitz had been president of the Musician’s Union and was chosen by political powerbroker Abe Ruef to run for mayor as a front for the Union Labor Party in 1901. Ruef constructed an effective political machine to win and retain power. Schmitz is considered to have been less corrupt than the Mayors who had preceded him, but he was little more than a puppet in the hands of his friend and master, Ruef, who wrote most of the mayor’s official papers and ran the city from behind the mayoral chair. Ruef was also sentenced to 14 years imprisonment and served a little more than four-and-a-half years of his sentence before being released, though he was not permitted to resume his legal practice. Before entering prison, he had been worth over $1 million, when he died in 1936, he was bankrupt.
Dr. Edward R. Taylor, Dean of Hastings College, agreed to step in as interim mayor and was given power to appoint new supervisors to replace those who had resigned, and most of the recovery from the Earthquake occurred on his watch.
Much of the city’s most important infrastructure dates to this period. In particular, the creation of abundant and stable water supplies would permit the sustained growth and development that created the city as it now stands.
The speed with which San Francisco was rebuilt was astonishing, and established a baseline of expectations internationally that was not shattered until New Orleans was devastated by Hurricane Katrina.
A mere nine years after the almost-complete destruction of the city, it was able to host the Panama-Pacific International Exposition. Officially, this was to celebrate the opening of the Panama Canal, but unofficially its purpose was to showcase the city that had been completely-rebuilt less than a decade after being wiped out by an Earthquake.
Depression? What Depression?
Fourteen years later, San Francisco was a financial capital, with a reputation for stability that was only enhanced by the 1929 stock market crash, when not a single San Francisco-based bank failed.
“…at the height of the Great Depression that San Francisco undertook two great civil engineering projects, simultaneously constructing the San Francisco – Oakland Bay Bridge and the Golden Gate Bridge, completing them in 1936 and 1937, respectively.
“It was in this period that the island of Alcatraz, a former military stockade, began its service as a federal maximum security prison, housing notorious inmates such as Al Capone, and Robert Franklin Stroud, The Birdman of Alcatraz.” – Wikipedia
While the rest of the country recovered, San Francisco forged ahead, hosting a World’s Fair in 1939-40, the Golden Gate International Exposition, creating an artificial island named “Treasure Island” to house it; several of the structures are now Heritage Listed.
War and Peace
During World War II, it was a major embarkation point for service members deploying to the Pacific Theater, and the Hunters Point Naval Shipyard became a major hub of military activity. This triggered a fresh boom for the city, as the explosion of jobs drew many people, especially African Americans from the South, to the area. After the end of the war, many military personnel returning from service abroad, and civilians who had originally come to work, decided to become permanent residents.
In 1945 it became the birthplace of the United Nations, and in 1951, the Treaty of San Francisco officially ended the war with Japan.
Contraction and The Summer Of Love
“Urban planning projects in the 1950s and 1960s involved widespread destruction and redevelopment of west-side neighborhoods and the construction of new freeways, of which only a series of short segments were built before being halted by citizen-led opposition.
“The onset of containerization made San Francisco’s small piers obsolete, and cargo activity moved to the larger Port of Oakland. The city began to lose industrial jobs and turned to tourism as the most important segment of its economy.
“The suburbs experienced rapid growth, and San Francisco underwent significant demographic change, as large segments of the white population left the city, supplanted by an increasing wave of immigration from Asia and Latin America. From 1950 to 1980, the city lost over 10 percent of its population.” – Wikipedia
Over this period, San Francisco became a magnet for America’s counterculture. Beat Generation writers fueled the San Francisco Renaissance and centered on the North Beach neighborhood in the 1950s.
Hippies flocked to Haight-Ashbury in the 1960s, reaching a peak with the 1967 Summer of Love. This was a golden year or so; it didn’t last. A year later, George Harrison visited, expecting to find a socially progressive, liberated, and spiritually awakened center; he left, disillusioned. Pattie Boyd described the occasion:
“We were expecting Haight-Ashbury to be special, a creative and artistic place, filled with Beautiful People, but it was horrible – full of ghastly drop-outs, bums and spotty youths, all out of their brains. Everybody looked stoned – even mothers and babies – and they were so close behind us they were treading on the backs of our heels. It got to the point where we couldn’t stop for fear of being trampled.” – The Beatles Bible.
The “Gay Mecca”
The gay population of San Francisco was given a boost during World War II, when the US Military began to actively seek out and dishonorably discharge homosexuals from the armed services. From 1941 to 1945, more than 9000 were discharged, many processed out in San Francisco.
Over the next 15 years, the city acquired a “gay tolerant” or even “gay friendly” undercurrent to its reputation as a radical left-wing center. While the hippies were attracting all the attention, a new wave of lesbians and gays with more radical attitudes also flocked to the city.
These new residents often lived communally, buying decrepit Victorians in the Haight and fixing them up. When drugs and violence began to become a serious problem in the Haight, many lesbians and gays simply moved “over the hill” to the Castro District (frequently referenced simply as “The Castro”) replacing Irish-Americans who had moved to the more affluent and culturally homogeneous suburbs.
In the 70s, The Castro emerged as an urban gay village and the city became a focal point of the Gay Rights movement and its opposition. San Francisco was home to the first lesbian-rights organization in the United States, the Daughters of Bilitis (1955); the first openly gay person to run for public office in the United States, José Sarria (1961); the first openly gay man to be elected to public office in California, Harvey Milk (1977); the first openly lesbian judge appointed in the US, Mary C. Morgan (1981); and the first transgender police commissioner, Theresa Sparks (2004).
The assassination of Milk, along with that of Mayor George Moscone, in 1978 focused national attention on the LGBT community of San Francisco and further galvanized that community. Following the Summer Of Love a decade earlier, this cemented the city in the popular zeitgeist as a center of liberal activism in the United States.
“Manhattanization”, redevelopment, and social problems
“[The] Bank of America completed 555 California Street in 1969 and the Transamerica Pyramid was completed in 1972, igniting a wave of “Manhattanization” that lasted until the late 1980s, a period of extensive high-rise development downtown.
“The 1980s also saw a dramatic increase in the number of homeless people in the city, an issue that remains today, despite many attempts to address it.
The 1989 Loma Prieta earthquake caused destruction and loss of life throughout the Bay Area. In San Francisco, the quake severely damaged structures in the Marina and South of Market districts and precipitated the demolition of the damaged Embarcadero Freeway and much of the damaged Central Freeway, allowing the city to reclaim The Embarcadero as its historic downtown waterfront and revitalizing the Hayes Valley neighborhood.” – Wikipedia
Dot-Coms and Technology
In the late 1990s, startup companies from the dot-com boom reinvigorated the economy.
“Large numbers of entrepreneurs and computer application developers moved into the city, followed by marketing, design, and sales professionals, changing the social landscape as once-poorer neighborhoods became increasingly gentrified.
“Demand for new housing and office space ignited a second wave of high-rise development, this time in the South of Market district. By 2000, the city’s population reached new highs, surpassing the previous record set in 1950.
“When the bubble burst in 2001, many of these companies folded and their employees were laid off [but] high technology and entrepreneurship remain mainstays of the San Francisco economy; By the [middle of the decade], the social media boom had begun, with San Francisco becoming a popular location for tech offices and a popular place to live for people employed in Silicon Valley companies such as Apple and Google.
“By 2013, San Francisco, with thanks from the Web 2.0 boom, had fully recovered from the late 2000s recession and [was] experiencing a real estate and population boom. The computer industry [was] moving north from Silicon Valley. Availability of vacant rental units became scarce and the prices for vacant units increased dramatically, and as of 2015 is reported to be the highest in the nation.” – Wikipedia
During the recession, the area South Of Market, which had been the bustling heart of the dot-com industry, went from being crowded with few vacancies to a virtual wasteland of empty offices and for-rent signs. Although still expensive by US Urban Standards, residential demand and rents eased considerably. The availability of cheap property was undoubtedly a factor in luring the Web 2.0 resurgence to the city, which attracted white-collar workers, recent University graduates, and young adults from all over the world, leading to a rise in residential demand and renewed rise in rents.
The city’s history of equal rights movements continued with the 2011 election of Edwin Lee as the first Chinese-American mayor in a major US City. Mayor Lee has proven to be a strong proponent of tenant’s rights as well as being business-friendly toward the tech community.
To ease residential demand, the city relaxed building height restrictions and zoning codes to construct residential condominiums though the GFC (also known as the Economic Downturn of 2008) halted some of this construction.
As you might expect from a city with “young attitudes,” San Francisco is a leader in the adoption of renewable energy. In April 2016, the city passed a law requiring all new buildings below 10 stories in height to have solar panels on the rooftop, the first major US city to do so, again reasserting the city’s claim to being one of the most progressive in the nation.
Geography Of San Francisco
The bulk of the mainland city forms a “seven-by-seven-mile square”, though it’s total area (including water) is nearly 232 square miles. San Francisco is known for it’s hilly terrain, the tallest of which is Mount Davidson (283m [928 feet] in altitude), one of several districts and neighborhoods named for the hill upon which they are situated.
The city has grown significantly beyond the natural geography; entire neighborhoods are located on areas of landfill. Unfortunately, such land tends to be unstable in earthquakes…
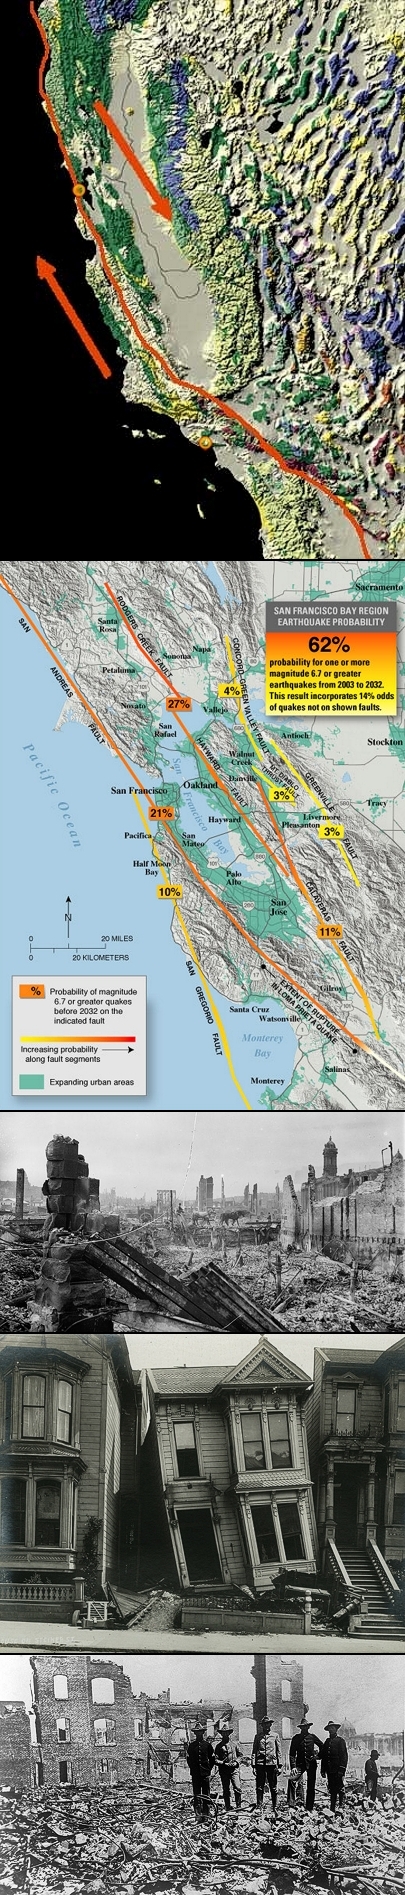
The Seismic Montage:
- USGS diagram of San Andreas Fault by Kate Barton, David Howell, and Joe Vigil, 14 March 2006. I’ve added indicators to show where Los Angeles and San Francisco are, relative to the main fault line.
- USGS seismic hazard map showing the probability of a magnitude 6.7 or greater earthquake occurring in the San Francisco Bay Area between 2003 and 2032, by fault-line. More recent analysis suggests that that the Hayward, Rodgers Creek, and northern Calaveras faults (all part of the Hayward Fault Zone) may be more likely to fail in the next few decades than was thought at the time this diagram was created.
- Aftermath of the 1906 San Francisco Earthquake by Arnold Genthe, from the Prints and Photographs Division of the US Library of Congress. May not be in the Public Domain in some countries.
- The House On Steiner Street by Stoddard, © DeGolyer Library, Southern Methodist University, No usage restrictions on low-resolution version.
- Soldiers in the rubble of the San Francisco Earthquake. This image may not be in the public domain in some countries outside the US.
The Fault Lines
The San Andreas and Hayward Faults both lie close to the city, though neither pass directly through the city. Both have been responsible for earthquake activity in the region. The larger earthquakes in 1906 and 1989 were caused by the San Andreas.
Los Angeles may be the oft-proposed site of “The Big One” (and in fact experienced a magnitude 5.6 ‘quake just offshore this morning [April 6]), but San Francisco is arguably more likely to experience a major seismic event, though this risk is taken in a more matter-of-fact manner.
You often get the impression that while LA residents know it might happen, they don’t really think that it ever will, while San Franciscans have experienced something that was as close as you would care to come to the real thing.
In response to their past, San Francisco has repeatedly improved the building codes and have constructed an auxiliary water supply. Many of the building code improvements also required retrofitting older buildings.
This played a significant role in the outcome of the 2013 Mythbusters test of whether or not standing in a doorway yielded the greatest chance of survival in a major earthquake. They constructed an earthquake shake-table that measured 13 feet by 11 feet, and then constructed a traditional masonry house on the earthquake simulation platform, and found that the doorway was indeed the safest location in a high-magnitude earthquake. They then constructed a timber-frame home on the platform according to the most up-to-date San Francisco building code and re-ran the test, finding that hiding under the table was now safer than the doorway by far. Their conclusion was that because older buildings of the masonry type were increasingly rare in San Francisco, and reasoning that other earthquake-prone zones would have implemented similar protections, on balance, the myth should be considered busted because it was not universally true – while noting that other locations which also suffered from earthquake risk may not have been as proactive in mandating retrofits.
(It must also be said that areas with low earthquake risk may not have any resistance at all specifically incorporated within their construction standards; that significantly increased the destruction caused by the Newcastle Earthquake here in Australia in 1989, which killed 13 and injured more than 160 despite being a (relatively) mild 5.6 on the Richter scale. Despite geoscientists knowing better, prior to this, Australia was immune from Earthquakes – at least in the popular zeitgeist.)
The Coming “Big One”
The first image in the “earthquake montage” depicts the San Andreas fault. I have added markers for Los Angeles, and San Francisco.
“A study published in 2006 in the journal Nature found that the San Andreas fault has reached a sufficient stress level for an earthquake of magnitude greater than 7.0 on the moment magnitude scale to occur. This study also found that the risk of a large earthquake may be increasing more rapidly than scientists had previously believed. Moreover, the risk is currently concentrated on the southern section of the fault, i.e. the region around Los Angeles, because massive earthquakes have occurred relatively recently on the central (1857) and northern (1906) segments of the fault, while the southern section has not seen any similar rupture for at least 300 years.
“Nevertheless, in the 11 years since that publication there has not been a substantial quake in the Los Angeles area… – Wikipedia
Studies by the USGS have assigned varying predictions for the next big one. One assigned a 7% probability that a magnitude 8.0 or bigger will occur somewhere along the San Andreas fault. But this is nothing new; for as long as I can remember, there have been warnings that the next “Big One” was due or overdue.
So why hasn’t it happened if it’s overdue?
A lot of people don’t understand probability when applied to infrequent events. If a study determines that a major event occurs once every hundred years, on average, that doesn’t mean that you can expect one to strike each century like the hour hand on a clock. It means that the long-term average period between events is roughly 100 years – and that assumes that the underlying conditions don’t change.
There could be a 200-year interval between any two events – and then 70 years, 90 years, 50 years, 70 years, 110 years, and 80 years. That yields a perfect 100-year average over a 600-year span. The longer the span, the greater the scope for variability in any given interval.
As a rule of thumb, when an event – seismic or weather or whatever – is officially designated a once-a-century event, what it means is that the scientist in question would be surprised if there were less than 50 years or so before the next one, and not surprised if there weren’t another for 150 years, all things being equal, and assuming no errors in the assessment methodology.
Image by MW Toews, based in concept on a figure by Jeremy Kemp via Wikipedia commons, license CC-BY-2.5.
A “once a century” event is simply one in which the peak probability of the next event is at the peak of the probability distribution.
Which means that, by definition, half the time the interval between events will be longer than a century, possibly even several hundred years. That’s not impossible, just unlikely – just as it’s unlikely but not impossible that the same event will be repeated next year.
The “Big One” is inevitably coming. But when it will occur, and how big it will be, is a lot harder to predict.
Readers interested in more specifics about the likelihood of an occurrence in the near future are directed to this page at Wikipedia. My conclusion: it could happen by 2050, but is more likely to happen after that date.

Looking back at the San Francisco region, it’s clear from the statistics that the likelihood of a major earthquake is relatively low, despite the two? three? four? that have taken place already in the last 120 years or so. Doesn’t mean it can’t happen, just that it isn’t likely to.
The 1906 earthquake was estimated to be magnitude 7.8. There was another of magnitude 5.7 in 1957, and a third in 1989 (magnitude 6.9 and actually in the Santa Cruz area), and a fourth in 2004 (magnitude 6.0 and actually in Parkfield). The 1989 quake caused fatalities and property damage in San Francisco, the 2004 quake did not (but was felt over a wide area of California, including San Francisco).
You can see why it’s hard to even decide how many there have been.
In the near future, at least, the threat posed by the weaker Hayward Fault Zone is probably of greater significance to San Francisco. This is a group of six fault lines running through the San Francisco area, roughly parallel to the San Andreas fault. In general, they have been responsible for relatively mild earthquakes over the last century, but that may be changing.
“Many seismologists believe that the 1906 San Francisco earthquake, which occurred on the San Andreas fault, reduced the stress on many faults in the Bay Area including the Hayward fault, creating an “earthquake shadow,” a quiescent period following a major earthquake.
“It also appears likely that this quiet period in the earthquake shadow is ending, as projected by the rate of plate motion and the stress state of other faults in the region.” – Wikipedia
Prior to the 1906 earthquake, there had been 4 significant earthquakes (magnitude 5.2 or more) in the system, the worst of which may have been as great as magnitude 7.0, and caused 30 deaths in 1868. Significantly, the area of the 1868 quake had not been significantly urbanized at the time, but has been since. If the 1868 earthquake were to occur today, the estimates are that the damage bill would top 165 billion US dollars and more than 5 million people would be directly affected.
For the thirty years following 2014, the estimated likelihood of a magnitude 6.7+ earthquake in the Hayward Fault Zone is 14.3%, compared to a 6.4% likelihood of an event of the same magnitude within the same period on the southern San Andreas fault. Another (2012) USGS estimate increases the risk to 31%, while a third (2015) raises the risk level to 72%, with the chances of a magnitude 7 or greater being 50%, and a 20% chance of magnitude 7.5-to-8.
This risk is beginning to affect San Francisco society.
“The progressively more severe reports and estimates of event probability and consequences have awakened a broad interest in training people for emergency response. It is becoming widely understood that professional fire fighting, police, and medical services will be overwhelmed by a major event and that neighbors will have to assist each other as best they can.” – Wikipedia
It is expected that the area response organization would be modeled on the 1950s civil defense structure, but as yet, nothing has been done. And it’s been 3-4 years. I smell politics getting involved, but that’s just my opinion.
The remainder of the images in the “Earthquake Montage” show damage from the 1906 Earthquake.
Climate In Winter
The climate of San Francisco is officially the “Warm-Summer Mediterranean Climate of the California Coast, but the sharp topography, high hills, and marine surroundings on three sides create a number of quite pronounced micro-climatic variations on this foundation.
The hills in the center of the city cause as much as a 20% variance in rainfall between different parts of the city, and also protect neighborhoods directly to their east from the foggy and sometimes very cold and windy conditions experienced in the Sunset District; for those who live on the eastern side of the city, San Francisco is sunnier, with an average of 260 clear days, and only 105 cloudy days per year.
That means that the specific location of the weather monitoring is something that needs to be taken into account. The official observation station is currently at the United States Mint building (opened in 1854 to serve the gold mines of the California Gold Rush). The current facility at the corner of 5th and mission streets was opened in 1937.
Location of the US Mint Branch within San Francisco. Click on the thumbnail to view a much larger version or for a copy of the large map without the mint location marked. Original map, based on OpenStreetMap project data, by Droll, license CC BY-SA 2.0.That puts it on the eastern side of Lone Mountain, a 421′ peak. There are lower hills to the north (Russian Hill, Nob Hill, Pacific Heights, Presidio Hill) and much taller peaks to the south such as Mt Sutro and Mt Davidson. That suggests that the location is going to be partially affected by the phenomena described earlier, making it a good compromise location. So BOTH the general micro-climate effects listed earlier have to be applied to this basis – areas west will be cloudier and rainier, areas east clearer and drier – but as much as areas to the near south-southeast.
I found this topographic map to be extremely useful in analyzing the information and this topographic map useful for interpreting the results.
Rising hot air in California’s interior valleys during summer creates a low-pressure zone that draws moist sea air from the North Pacific High through the Golden Gate, creating the characteristic cool winds and fogs for which the city is infamous. This phenomenon is weakest in late summer and early autumn; because of this, the warmest month is usually September, and October is usually warmer than July, especially in the daytime.
This makes picking out the start and end points of some of the seasons especially difficult. Fortunately, winter is not one of them, clearly running from December through February. High Summer, on the other hand, appears to be split up by a two-month “false autumn” early in that season that will make that time of year more complicated, and the real autumn seems quite truncated as a result.
It’s as though the seasons ran:
- Spring (3 months, March to May);
- Early Summer (June);
- Early Autumn (2 months, July and August);
- Late Summer (2 months, September and October);
- Late Autumn (November);
- Winter (3 months, December to February).
I will probably treat the entire 5-month span from June to October as “Summer” and Autumn as a single month in duration. But that’s a decision for another day.
Record highs for the Winter months are Dec 24°C (76°F), Jan 26°C (79°F), and Feb 27°C (81°F), respectively. With the record high for the preceding month being 30°C (86°F), it is clear that the change of seasons is quite rapid.
It doesn’t normally get anywhere near that high; the mean of the highest temperatures each month is roughly 5°C (11°F) lower than these record highs. Specifically, the records to 2010 show values of Dec 19.1°C (66.4°F), Jan 19.6°C (67.3°F), and Feb 22.5°C (72.5°F).
More likely temperatures each day are 5-7°C (9-12°F) cooler again, specifically Dec 13.9°C (57.1°F), Jan 13.8°C (56.9°F), and Feb 15.7°C (60.2°F), respectively.
The three winter months are the only ones in which the record low temperature of the day is below freezing: Dec -3°C (27°F), Jan -2°C (29°F), and Feb -1°C (31°F). Given that San Francisco is only about 3 degrees of latitude, the differences between the Eastern and Western seaboards could not be more pronounced.
Of course, these are – by definition – exceptionally cold. Averaging the minimum recorded temperatures gives a better idea of how cold (at worst) it’s likely to get: Dec 4.5°C (40.1°F), Jan 4.6°C (40.3°F), and Feb 5.4°C (41.8°F).
Most days, it won’t even get that cold, but it will get close; there isn’t a lot of difference (about 3°C (6°F) between the averages of the minimum temperature of each month and the average minimum temperature each month: Dec 7.8°C (46.1°F), Jan 7.6°C (45.7°F), and Feb 8.6°C (47.5°F).
Winter doesn’t so much end as taper off. The temperature differences between March and April are very similar to those between February and March.
The same can’t be said of the rainfall pattern. Autumn through Winter and into Spring is the rainy period for the city, while the summer and “early” autumn are relatively dry.
December brings, on average, 115.8mm (4.56 inches) of rain on 11.6 rainy days, or slightly more than 1 day in three and an average fall of 10mm (0.39 inches).
January is statistically a fraction drier at 114.3mm (4.5 inches) with a slightly greater frequency of falls (11.7 rainy days). When you break that down to daily values, the difference is minuscule, and easily swallowed by daily variations; I doubt it would even be noticeable “on the ground”.
The same is not true of February, which experiences 113.3mm (4.46 inches) over 11.1 rainy days, despite initial appearances. Correcting for the length of the month shows that the frequency of rainfall goes up slightly, and the average fall is up almost 7%, enough to say that at least one fall would be significantly heavier.
I do get the impression that frequent light drizzles are more common than full-on rainy days, but have only the above statistics to back that up.
However, Wikipedia warns (through NOAA data) that the variation in precipitation from year to year is high. Above average rain years are often associated with warm El Niño conditions in the Pacific while dry years often occur in cold water La Niña periods. In 2013 – a “La Niña” year – a record low 142mm (5.59 inches) of rainfall was recorded in downtown San Francisco over the year, less than 24% of the average.
Snow is very rare, with only 10 measurable falls since 1852, most recently in 1976 when up to 5 inches (130 mm) fell on Twin Peaks.
Cloud cover is frequent over autumn and the winter months. The yearly average excluding those months is 72.125% of the available sunshine; compare that with 57% (November), 54% (December), 61% (January) and 69% (February). Only the latter comes close.
One final word on the subject by WhiteDahlia, a contributor to Trip Advisor Australia’s forum in response to a question about San Francisco’s weather in Winter:
“Historical averages for January in SF are a Google search away. But historical averages are just that and rarely do we have an ‘average’ year.” – WhiteDahlia
So take the information and analysis provided above as a foundation, but not as gospel!

Scenes Of San Francisco Montage Notes and Credits:
- San Francisco Skyline, copyright-free image via PXhere, License CC0.
- The Transamerica Building (also known as the Transamerica Pyramid), as viewed from Colt Tower, 18 June 2006. Image by Daniel Schwen, License CC-BY-2.5. This is one of the most iconic and recognizable structures in San Francisco.
- San Francisco cable car no 3, image by jjron (John O’Neill) 25 March 2012, License GNU Free Documentation Ver 1.2. Pier 45/Fisherman’s Wharf in the background. Note also the slope of the terrain, another iconic feature of the city, regularly featuring on TV and in movies set in San Francisco.
- Lombard Street, world famous for it’s one-block section with eight hairpin turns (5 mph speed limit!), often claimed to be “the crookedest street in the world”. I’ve been down it in a large tour bus! Vermont Street, San Francisco also lays claim to the title, but while it is even steeper than Lombard Street, it only has seven turns. The other notable contender is in Burlington Iowa, and also has 8 turns but over a shorter distance.
- Lombard Street Night Time-lapse, photo © David Yu from Flikr via Wikipedia Commons, License CC-BY-SA 2.0. The lights of the vehicles descending clearly show the hairpins that make the street famous. Attribution information, such as the author’s name, e-mail, website, or signature, that was once visible in the image itself has been moved into the image metadata and/or image description by Wikipedia.
- Alcatraz Island by Wikipedia User: Ciell, License CC-BY-2.5 NL. I had the opportunity to tour Alcatraz when I visited San Francisco but the Family decided not to avail themselves of it (as I recall, it wasn’t a free side-trip).
- Cliff House from Ocean Beach, image by Brocken Inaglory, License CC-BY-3.0 Unported.
- Chinatown Lanterns, San Francisco, by Belle Co via Pexels, License CC0. Frisco’s Chinatown may be famous, but it isn’t much to look at – this captures it at its best.
- Golden Gate Park from the air, photo by Hispalois.
- The Redwood Trail, in the San Francisco Botanical Garden (formerly the Strybing Arboretum) by Stan Shebs – this is just one of the many diverse natural views contained within the Golden Gate park.
- The Golden Gate Bridge via PXhere License CC0
- One of San Francisco’s notorious fogs, seen from the Marin Headlands at Sunrise. Image © Frank Schulenburg / CC BY-SA 3.0. Image taken August 2013. The tips of the Golden Gate are visible peeking through the blanket of fog.
Things to do in a San Francisco Winter
“Tourism is one of the city’s largest private-sector industries, accounting for more than one out of seven jobs in the city. The city’s frequent portrayal in music, film, and popular culture has made the city and its landmarks recognizable worldwide. It attracts the fifth-highest number of foreign tourists of any city in the United States and is one of the top-20 destination cities worldwide by international visitor spending. More than 25 million visitors arrived in San Francisco in 2016.” – Wikipedia
My abiding impression of San Francisco is that it’s a great place for adults to visit, but of limited interest to kids, as I said in introducing the city.
A number of things deserve mention as places to see, but you will find most all of them in the notes attached to the photo montage, so I have restricted myself to listing a few that weren’t.
Year-round:
- The most-visited museum in San Francisco is the California Academy of Sciences, which contains a planetarium, an aquarium, a four-story living rainforest, and a natural history museum with, amongst other things, the fossilized skeleton of a T-Rex. Let’s be honest – you could probably spend several days exploring everything this place has to offer.
- San Francisco has several theaters offering live performances during the colder months, in what is simply known as the Theater District.
- City Bus Tours – there are several of these that vary in price and duration. Almost all of them show the Golden Gate Bridge, Chinatown, and Fisherman’s Wharf; some include 19 stops. One tour lets you set your own pace, another includes a visit to Alcatraz, and a third is an evening tour – which is excellent for seeing the downtown lights (refer December Events, below).
- These days, one of the city’s most popular attractions is a tour through Alcatraz, the Federal Prison that once held the nation’s worst criminals. Tickets tend to sell out quickly. Tours operate seven days a week, and in the evenings from Thursday to Monday. Dress in warm clothing for the 20-minute Ferry ride to and from the Island.
- The Exploratorium is a science museum which emphasizes the buzzword of 21st century displays – interactivity. Five large galleries explore sound and vision, the structure of living things, weather, mechanics, and human behavior, respectively.
- San Francisco holds almost 50 different film festivals each year, each with a different theme, genre, or culture. Winter festivals include the American Indian Film Fest, the Transgender Film Fest, Save the Waves, Noir City, the SF Indie Fest, and the Mostly British Film Festival. You can examine a full list of the festivals at this website.
- Whale Watching tours take place all year round. From December to May, the focus is on Gray, Sperm, and Killer Whale migrations. Sightings occasionally include dolphins, leatherback turtles, and sea lions.
- The Napa valley and Sonoma County, both located close to San Francisco, produce some of the best wines in the America. You can head for the source to explore for yourself or attend one of the regular wine-tastings. Wine is popular in this part of the country.
- Just across the road from the California Academy of Sciences is the de Young Art Museum, which contains more than 25,000 works from all over the world. Permanent exhibits include pieces from pre-Columbian to 20th century America, and artwork from sub-Saharan Africa, New Guinea, and Indonesia. Tickets also grant admission to another fine art museum, the Legion of Honor.
- San Francisco has a world-famous Zoo. Visit it anytime, but there are special events in later December for Kids, known as the “Zoo Lights”.
- The Children’s Creativity Museum is “known for its state-of-the-art, hands-on exhibits that explore art and technology” – which makes it like any number of other children’s museums, though the inclusion of art as a focus is a point of distinction. Interactive exhibits include an animator’s studio, music production lab, digital workshop, studio z, and more.
- Cooking classes are a popular pastime in San Francisco, especially at this time of year, and supply has evolved to meet the demand. Three that have been recommended by others are the San Francisco Cooking School, Tante Marie’s, and the Cheese School of San Francisco.
- I don’t know of anywhere that has an active foodie scene that doesn’t have an active coffee scene to compliment it, and San Francisco is no exception. Lots of high-end coffee shops can be found in different corners of the city.
November/December:
San Franciscans date Winter as starting on Thanksgiving (or thereabouts), so there is some “bleed” of seasonal activities into November. That said, Winter is the “quiet time” for tourism – which, if you can tolerate the weather, provides considerable advantages in terms of queue lengths and availability of tickets (with a few exceptions noted).
- San Francisco has several different tree-lighting ceremonies to attend. A number of them also incorporate refreshments and live entertainment. Amongst the most popular choices are Pier 39, (From Noon, Sunday Nov 19 in 2017, and the tree is re-lit nightly at 6PM throughout the season), Union Square, (6PM, Friday Nov 24 in 2017), Ghirardelli Square (from 7PM, Friday Nov 24 in 2017, this is more adult-oriented than many of the other events), 555 California (6PM-9PM, Wed Nov 29 in 2017), The Ritz-Carlton (5:30 PM to 7:30PM, Thursday, Nov 30 in 2017), Westfield Mall (6PM to 8PM, Thursday Nov 30 in 2017), Rainbow World Tree Of Hope at City Hall (5:30PM to 8PM , Wed, Dec 4 in 2017), and The Presidio (5PM to 6:45PM, Friday, Dec 8, in 2017 – and take a flashlight for the guided lantern-walk). On top of that, many buildings and structures sprout decorations, and some residential neighborhoods also maintain a tradition of richly decorative displays at this time of year.
- Every year, starting in mid-November and running until Mid-January (sometimes longer if the show is popular that year), Cirque du Soleil brings their latest masterpiece to the San Francisco public.
- From mid-November until mid-December, weekends bring the Great Dickens Christmas Fair, a slightly-romanticized recreation of Charles Dickens’ London, complete with period-appropriate shopping, dining, and entertainments.
- In mid-December (it took place on Dec 15 in 2017), from 6PM to 8PM, Fisherman’s Wharf hosts the oldest and largest holiday boat parade, with more than 60 colorfully illuminated boats sailing along the coastline.
- Like most cities, San Francisco has a fireworks display at midnight on New Year’s Eve. There are also dozens of public parties to attend, NYE cruises, and concerts.
- For the last 5 years, Illuminate SF have held a Festival Of Light on Thursday nights through December. This celebrates the city’s many light-art installations with a series of three specially-guided tour.
January:
- The first week of January is San Francisco Art Week. There are two contemporary art fairs that comprise this event.
- Each year, at some point in January, droves of Sea Lions take up a temporary residence at the K-dock of Pier 39, “camping out” for a while. This convergence of man-made urban environment and nature is a popular event and attraction for locals as well as visitors.
- The San Francisco area’s biggest comedy festival occurs for a week early in January. It’s well-known for innovation and creativity within the comedic community, nation-wide, including workshops, presentations, kids events, podcasts, improv shows, and more, at locations all over the city.
- The last week (or so) of January is given over to the San Francisco Restaurant Week, which actually lasts ten days. I don’t have too many details of what this specifically comprises, but suspect that it’s something similar to the events of other cities – see, for example, the Denver, Spokane, and Seattle entries above.
February:
- San Francisco’s Chinatown is legendary, and that means that the city really kicks out all the stops when it comes to celebrating Chinese New Year with close to a month of events, the highlight of which is the annual parade with colorful dragons, lion dancers, drums, and lanterns through the downtown streets. Other related events include a flower market fair, basketball jamboree, Miss Chinatown pageant, street fair, and a 5K-10K run.
- The annual Chronicle Wine Competition gives visitors the opportunity to sample more than 800 award-winning wines. The competition selects the best American Wines from (usually) more than 5000 entrants.
- The San Francisco Giants start the baseball season early with the “Giants Fan Fest” every February. This event gives fans the chance to meet the players, get their autographs, pick up new merchandise, and play catch on the field. Traditionally, this event is one of the accepted signals that Winter is ending.
- Of course, any city that celebrated the “Summer of Love” can be expected to have a host of Valentine’s-Day related activities.
- The Noise Pop Festival in late February is a Music Festival with a focus on indie music.
Primary Sources:
- Wikipedia’s San Francisco page;
- Wikipedia’s History Of San Francisco page;
- Wikipedia’s page on the California Gold Rush;
- Wikipedia’s page on the San Andreas Fault;
- Wikipedia’s page on the Summer Of Love;
- The Gold Rush of 1849 by History.com;
- 8 Things You May Not Know About the California Gold Rush by Barbara Maranzani for History.com
- Bubonic plague hits San Francisco 1900-1909 by PBS.org;
- George Harrison visits Haight-Ashbury in San Francisco from The Beatles Bible
- San Francisco Tree Lighting & Holiday Events 2017 from SF Tourism Tips
- Things to Do in San Francisco in the Winter from SF Tourism Tips
- 10+ Things to Do in San Francisco in Winter 2018 – January & February Activities & More by Casey Makovich for the Go Card San Francisco Travel Blog.
- Things To Do in San Francisco in the Winter by Andi Fisher for her blog, “Misadventures with Andi”.
- Everything to Do in San Francisco This Winter (Including All the Holiday Cheer You Can Handle) by Allison McCarthy for PureWow, a women’s lifestyle online magazine.
That concludes part 4 of this series. I’m going to take a week or two off from it in order to finish up another massive post because the unwritten parts of it are starting to become vague in my memory and I want to try and finish it before it’s too late.
While I’m doing so, expect “regular” Thursday posts to resume. Besides, a change is as good as a Holiday, as they say.
When this series does resume, it’s off to the Central Pacific and Asia for Winter in Honolulu, Bangkok, Tokyo, Beijing, Tibet, and Nepal (I can feel the snow piling up from here…)