The Diversity Of Seasons Pt 3: Winter (cont)
- The Diversity Of Seasons Pt 1: Winter
- The Diversity Of Seasons Pt 2 – Winter (cont)
- The Diversity Of Seasons Pt 3: Winter (cont)
- The Diversity of Seasons, Pt 4: Winter (cont)
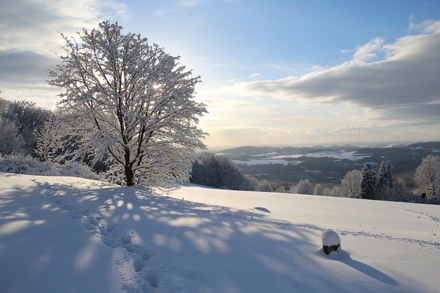
Image courtesy Pixabay.com and licensed under CC0.
With the 2nd part of the series containing some of the locations of greatest climatic diversity or other significant recent history that needed discussion, it threatened to grow far too large for ready consumption.
That necessitated a restructuring of this series into twenty parts instead of the sixteen originally planned.
Actually, the original plan was four posts, one per season, but it’s easy to see why that idea quickly vanished beneath the permafrost!
Under the restructure, this part will now focus on a number of locations that, between them, represent huge climatic diversity. And yet, if you exclude the ringer (Honolulu, Hawaii), the entire section focuses on just four degrees of latitude (2.22% of the hemisphere) on one continental landmass – from Chicago in the north to San Francisco in the south.
Part 1 of this series began a concordance of Seasonal Experiences with Winter descriptions for McMurdo (Antarctica), Hobart, Melbourne, Sydney, Brisbane, Tahiti, and Cairo.
Part 2 covered Winter in Brazil, Puerto Rico, Miami, New Orleans, and New York City.
This is Part 3, which will contain Omaha, Las Vegas, Washington DC, Chicago, San Francisco, and Honolulu. Now with extra added Detroit!
Part 4 will detail Tokyo, Montreal, Madrid, London, Glasgow, and Berlin.
Part 5 will wrap up Winter, dealing with Switzerland, Stockholm, Moscow, Siberia, Anchorage, and Reykjavik.
Thereafter, parts 6-10 will handle Spring (same cities), parts 11-15, Summer, and parts 16-20, Autumn. At about 10,000 words each, the series should total approaching a quarter of a million words by the time it’s done! I intend to put a week’s gap in between each quartet, so it should be finished sometime toward the end of the year!! In fact, the goal is to finish by December at the latest.**
I’ve written earlier in this series about the initial plan of presenting cities in sequence of latitude, from the extreme south to the extreme north, so as to take one variable out of the climatic equation and enable GMs to grasp the bigger picture, and of the discovery that, while it wasn’t a factor to be ignored, latitude was one of the least relevant factors.
Another way of looking at this series is: Part 1 looked at Latitude, Part 2 dealt with the Western Atlantic, Part 3 will look at Longitude, Part 4 will contrast the Western Pacific and the Eastern Atlantic, and Part 5 will focus on Eurasia and Latitude vs Longitude – then repeat the sequence for the other seasons of the year.
So, let’s sweep from the East to the West of the USA…
* This plan has since changed (again!) – refer the “Day 9” update in the comments!
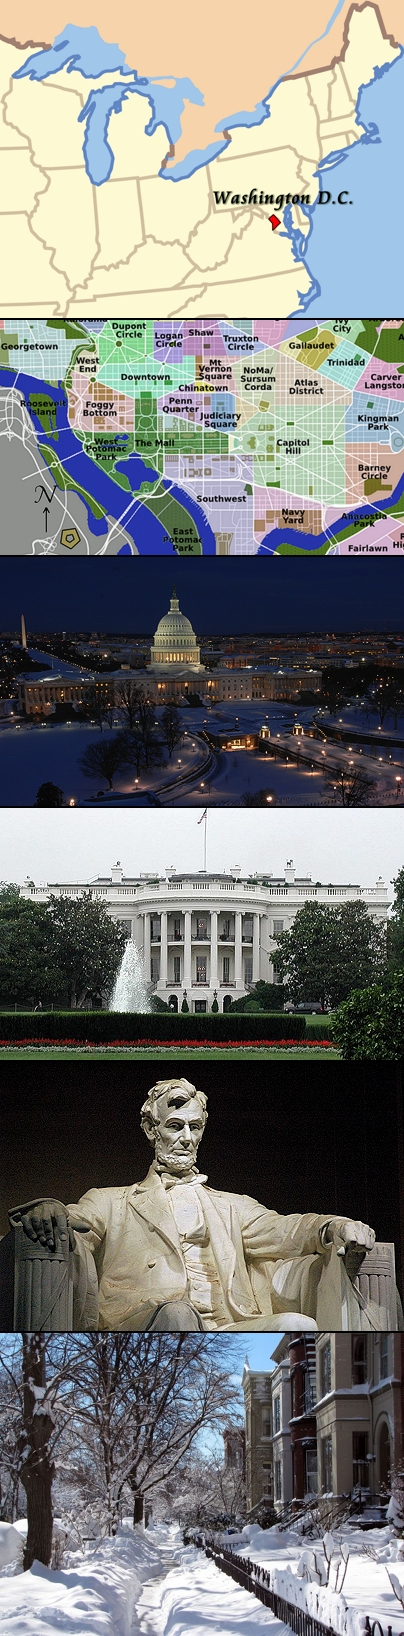
This montage contains:
- A map of the Northeastern USA highlighting the location of Washington DC;
- A map of the inner districts of the city;
- “Washington DC 85531” by unknown (courtesy pixabay.com) which shows both the Capital Building and the Washington Monument;
- “White House South” by Raul654 (and edited by Mike),
- “Lincoln Memorial” by Jeff Kubina, and
- “5th Street at A Street Southeast” by Katja Schulz via Wikipedia via Flickr, which shows the typical residential architecture of the city.
Except where otherwise noted, all images used to illustrate this article have been sourced from Wikipedia Commons, and are used under creative commons CC3.0 or later.
13. Winter in Washington DC
New York may have justifiable claim to being the most famous city in the world, but Washington DC isn’t far behind, and just as full of iconic locations and buildings.
What would surprise quite a number of people who have never been there is how close these locations are to each other. A huge number of them stand within walking distance, as is shown by the first image after the maps in the montage to the right, where you can see both the US Capital Building, the reflecting pool, which readers may remember from Forest Gump if nothing else, and – in the extreme distance behind the Washington Monument – the Lincoln Memorial. What people might not realize or be able to make out in the image is that it also contains the Korean War Veterans Memorial (the famous three soldiers statue), the National World War II Memorial, the National Museum of American History, the National Museum of Natural History, the National Air and Space Museum, and the White House!
The city is built, famously, on reclaimed swampland. That fact conjures up certain perceptions about the geology and the climate that may not be all that accurate; so let’s set them aside and look at the facts.
Reclaiming swampland logically involves one or both of two things: building up the land, or preventing the water from reaching the land in the first place. The second approach leaves an area vulnerable to flooding but is faster, cheaper, and easier than the first.
In the case of Washington DC., neither was necessary. The story of Washington being built on reclaimed land is 99% myth. Some historians, I am informed, disregard that 1% and simply declare the whole story to be a falsehood; but according to the Washington Post, there was a small pocket of genuine swamp at the edge of the Anacostia, at Tiber Creek, which is now Constitution Avenue near the current location of the National Gallery, and at Swampoodle, an Irish neighborhood. The rest was perfectly arable farmland, forest, or waterway.
The page also busts a number of other myths about the capital; it’s fairly short, light, and good reading. Interestingly, the link to that page is the ONLY mention of “Swamp” on Wikipedia’s Washington DC page, which was a primary research source for this article.
Historical Fact & Political Reality
Washington was founded in 1791 to serve as the National Capital, the states of Virginia and Maryland literally buying the right to have the then-unnamed District of Columbia located in their part of the world.
A locally-elected mayor and a 13-member council have governed the District since 1973, but Congress maintains supreme authority over the city and may overturn local laws. From time to time, the administration of the city has been turned into a political football by different administrations; this is particularly true of National Shutdowns, which affect DC disproportionately to anywhere else in the country. For this reason (amongst others), there is a continuous active minority agitating for DC to become a fully-fledged state in its own right. There have been many fruitless attempts to achieve this, the most recent being 1982 when citizens were last consulted – a consultation that Congress ignored almost completely.
The fact that DC has no representation in Congress (and therefore no say in its laws) is one of the primary motivators behind this statehood movement.
Despite the repeated failure of these attempts, Washington remains somewhat more politically-engaged than most US voting districts; 60-61% of the population have voted, each time, in the last three presidential elections. In terms of affiliation, D.C. is strongly Democrat; Donald Trump received only 4.1% support in the 2016 elections, while Clinton was the favored candidate of 90.5% of the population. This was the most polarized Presidential vote since participation began in 1964, the previous record being the 6.53% support for John McCain vs the 92.46% support for Barack Obama. Support for a Republican candidate has never outweighed that of the Democrats in DC; the closest elections have been for Richard Nixon (both in 1968 [18.18% vs 81.82%] and in 1972 [21.56% vs 78.10%]).
Like New York City, this is a location that I have visited, however briefly. We were about a block into what was later described to us as the “black neighborhood”, and one of the abiding memories is seeing a line item on the Pizzas my friends and I had delivered, ‘danger money’ (or words to that effect)! (Despite the mild paranoia created by that and the presence of a burned-out automobile across the road from our hotel window), it should be noted that we had zero negative experiences with the locals during our time there. At the time, we felt that we had allowed enough time to see it all, but afterwards we wished that we had more time (and budgetary resources) to spend.
Racial Migration
Washington DC has always had a large ethnic population; in 2014, 49% were black, 43.6% white, 4% Hispanic or Latino, and 3% asian. Interestingly, the black population is steadily declining as middle-class and professional African-Americans migrate into suburbs located within Maryland and Northern Virginia, pushed out by a rising cost of living in the area and the process of gentrification, which describes renovating dilapidated neighborhoods with an influx of more affluent residents. In this case, whites and asians are flooding into formerly black neighborhoods and renovating them, and the process is accelerating.
The Anomalous Climate
It is somehow apt that the climate of the city is anomalous. The surrounding region is considered to have a humid subtropical climate, but Washington is officially a Temperate Maritime Climate.
Winters are usually chilly with light snow, and summers are hot and humid. Spring and fall are mild to warm, while winter is chilly with annual snowfall averaging 15.5 inches (39 cm). Tornadoes and Hurricanes are both rare but possible events in the appropriate times of year.
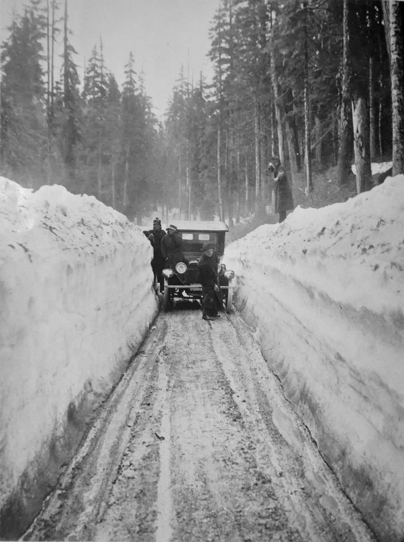
Although it is not-entirely inappropriate to accompany a discussion of “Blizzards”, this evocative photograph from 1909 is actually from Washington STATE and not from the District Of Columbia (the pine trees are something of a dead giveaway). Search Engine results are frequently full of such errors when the subject is Washington DC – at least, that’s my justification for putting this image in front of you at this point!
Blizzards affect Washington on average once every four to six years. The most violent storms are called “nor’easters”, which often affect large sections of the East Coast.
January 27-28 of 1922 saw the city officially receive 28 inches (71 cm) of snowfall, the largest snowstorm since official measurements began in 1885.
Anecdotal records claim that the city received between 30 and 36 inches (76 and 91 cm) from a snowstorm in January 1772.
Winter is very clearly December to February. It is preceded by an autumn that is arguably only 2 months long and followed by three months of spring. The lowest recorded temperature is -15°F (-26°C), on February 11, right before the Great Blizzard of 1899. Typically, 64 nights a year are below freezing.
The record highs over these three months are 26°C (79°F) in December and January and 29°C (84°F) in February. Most days at this time of year are (respectively) around the 8.2°C (46.8°F), 6.3°C (43.4°F), 8.4°C (47.1°F) mark, but the hottest day of each month (on average) is 19.1°C (66.4°F), 18.6°C (65.5°F), and 19.7°C (67.5°F), respectively.
The record nightly lows are, respectively, -25°C (-13°F), -25.6°C (-14°F), and -26.1°C (-15°F), so getting slightly colder in each month of the season, but these are the results of unusual weather, showing that if it occurs, the later in the season, the worse it can be expected to be.
The usual minimum temperatures are 0.3°C (32.5°F), -1.9°C (28.6°F), and -0.6°C (30.9°F), respectively, which shows that midwinter is usually the coldest time of year. The coldest nights of each month average -7.7°C (18.2°F), -10.6°C (12.9°F), and -8.6°C (16.6°F), bearing out that analysis.
The humidity is relatively consistent all year round, varying from a high in late summer of 69.7% to a low of 58% in mid-spring. Through winter, the averages are 64.1%, 62.1%, and 60.5%, respectively.
Of the three months, December is the wettest, averaging 77.5mm (3.05”) of rain over 9.7 days (almost 1 day in 3). January and February average almost the same amount and frequency of rainfall if you correct February’s length to a more representative 30.5 days length – 71mm (2.8”) over 9.6 days out of 31 (9.7 in Feb, corrected), or roughly one in three-and-a-quarter days.
Of course, these are three of the four driest months of the year because snowfall is not counted in the above. While snow occasionally falls in November (1.3cm / 0.5”) and March (3.3cm / 1.3”), and trace amounts have even been reported in April, the winter months are the usual snow periods. December is the lightest snow month of the season (5.8cm / 2.3” over 1.5 snowy days); January sees falls of 14.2cm (5.6”) over 3 snow-days, while February is the most bitter with an average of 14.5cm (5.7”) over 2.4 snowy days despite the shortness of the month. Corrected to a comparable time-span, those values would be 15.6cm, 6.15”, and 2.6 snowy days – so there are fewer snowfalls late in the season but the ones that do occur are heavier.
Winter, plus the addition of November, averages significantly less snowfall hours per month than the rest of the year, more than can be accounted for by shortened days alone. The November average is 150.2 hrs (5 hrs per day, average); December is 133 hrs (4.3 hrs per day, average); January is 144.6 hrs (4.66 hrs per day, average), and February is 151.8 hrs (5.37 hrs per day, average). That equates to 50%, 45%, 48%, and 50% of the possible sunshine, respectively. The rest of the year has values of 203.6-280.5 hrs per month, respectively, so a significant drop occurs over these four months.
Only In Washington: Activities or the lack thereof
While there are a few seasonal activities like ice-skating by the waterfront or viewing the National Christmas Tree, most activities are simply the usual tourist displays with a seasonal twist – shopping in the cold instead of the humid heat, dining by the fire, visiting national attractions, museums, and so on – at least according to the city’s official tourism page for the season, ‘Your ultimate guide to wintertime‘.
Smart Destinations’ 10+ Things to do in Washington DC in Winter 2018 adopts a similar line, but still sells the tourist experience as being (arguably) better at this time of year; “You’ll be treated to shorter lines, cheaper hotel prices and airfare, and less crowding at the most popular attractions. Best of all? The cold weather doesn’t even really last that long, so by the end of February you’re looking at warming temps.”
The Smithsonian Zoo dresses up in hundreds of thousands of little twinkling lights, supplemented by live music, rides, snack and shopping opportunities. Since the Zoo isn’t usually open at night, this is a rare opportunity to view nocturnal residents and something genuinely different to the usual experience on offer.
But it – plus the aforementioned ice skating etc and other seasonal observances such as the National Hanukkah Menorah – is about it.
In a way, this is understandable. Washington is an archetypal “company town” in which the “company” is the National government. Even that winds down during December and early January – a little – unless you are directly engaged in service to the Government; you are either busy working or trying to get home to somewhere else where there may undoubtedly be seasonal activities. Inauguration Day and the 4th of July are when Washington really comes to life.
Of course, there are certain to be numerous private Christmas Parties and events within the White House itself for the benefit of those who have to work. Among the most prestigious of those “private” parties are the seasonal receptions of the city’s embassies; the number varies, but is usually 168-175. Chinese New Year is – as is the case in many other cities – a big deal, with an annual parade in WDC’s Chinatown. But other times of year are the setting for most of the significant cultural activities.
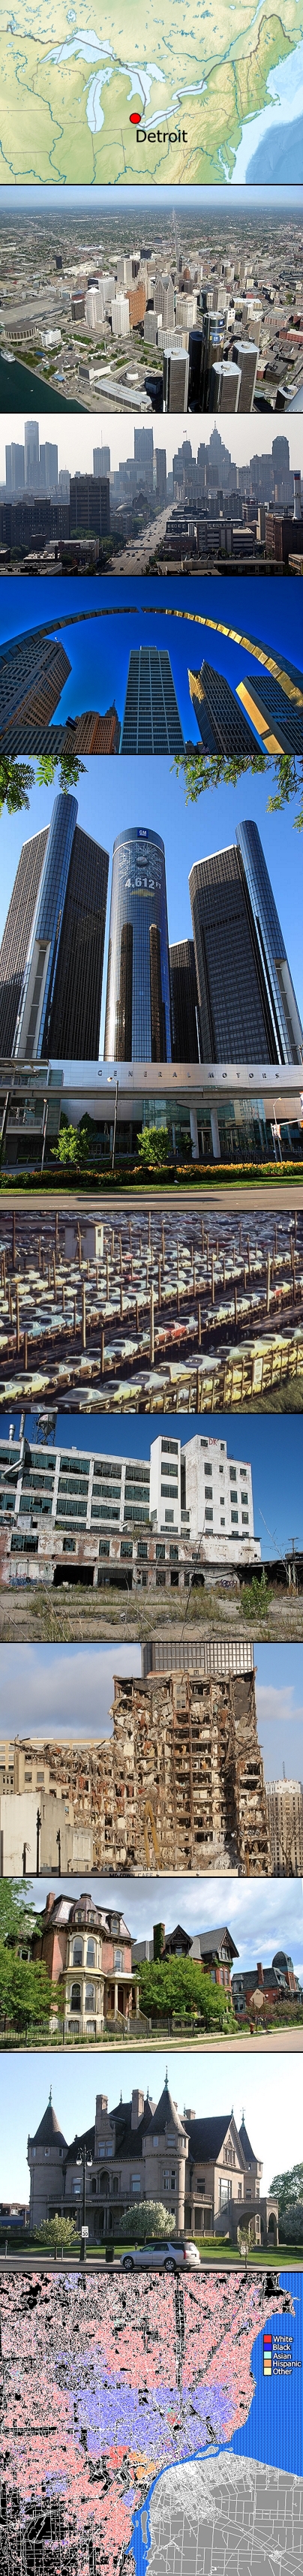
Detroit Montage contents & Photo Credits:
- Detroit location map;
- Aerial View of Downtown Detroit; Detroit-2361585 by puzzleboxrecords via pixabay.com, usage CC0;
- Hart plaza Detroit via pxhere.com, usage CC0;
- The Renaissance Center, Headquarters of GM, and 2nd tallest building in the western Hemisphere;
- New cars being loaded onto railroad cars in Detroit, 1973;
- Detroit Derelicts 1225580 by maha rashi courtesy freeimages.com;
- The LaFayette Building, Detroit, in the process of being demolished after years of mismanagement;
- Brush Park, Detroit, MI by Elisa Rolle; Hecker House, Detroit, Michigan by Andrew Jameson;
- Race and ethnicity map Detroit 2010 Census (modified by Mike for contrast).
14. Winter in Detroit
Detroit is a city of three faces. In the 70s and before, the public image, at least as far as foreign consumption was concerned, was gleaming, modern, and industrial, the beating heart of the motor industry and Motown.
Even though the film was set in Pittsburgh and not Detroit, “Gung Ho” (known as “Working Class Man” here in Australia [and supposedly a comedy, though I’ve always assessed it as a dramatic work with a few comedic moments that mostly fell flat]) was the first inkling that many people had that all was not well in the American automotive industry.
People gradually became aware that the industry was crumbling, and the city it built along with it. Which brings forth the second face of Detroit – something that looks dystopian, even post-apocalyptic. It is this Detroit that provides the inspiration for the backdrop to the original Robocop, and it also forms much of the backdrop to the reality TV series, “Hardcore Pawn”. Detroit, in 2013, became the largest US City to file for bankruptcy.
But the auto industry eventually turned a corner (unlike the situation in Australia – but don’t get me started on that subject), and Detroit – at least in some areas – also began to recover. In December 2014, the city exited Bankruptcy and regained control of its finances. Restoration of many of the older buildings has produced the third face of Detroit – architecture that feels old in style (even medieval).
The heart of Detroit is still African-American, just as it was when Motown was at it’s height, but it is surrounded by a ring of Caucasian residences – and, through the process of gentrification (explained in the Washington DC entry) the city is slowly transforming itself into a new Detroit.
All three faces are contemporary to at least some extent, which is why all three are featured in the accompanying photo montage. Much of the city is populated by those suffering economic distress. But Detroit’s is a story of hope and renewal.
Perspectives & Distortions
The first thing that you notice when you look at the Aerial View of the city is that it seems much smaller than you imagined. This is a false impression, as you can see from the Census map that ends the montage, an illusion created by a small and compact high-rise region and a great deal of relatively flat suburban sprawl around it. In truth, this is the most populous city in Michigan and the 2nd-largest in the Midwest, second only to Chicago.
In fact, there are two adjacent high-rise areas – the Renaissance Center is an entirely separate cluster of skyscrapers.
Climate
Detroit’s story has always been entwined with the Detroit River and the Great Lakes into which it feeds, and it is obvious from the outset that this will also be a factor in the local weather patterns. Detroit’s weather is officially “Humid Continental” in type – the same as parts of New York City.
Winters are cold and experience moderate snowfall.
For 44 Days in a typical year, the temperature will not rise above freezing, and for an average of 4.4 days in the same span, they will drop below -18°C (0°F). The coldest temperature recorded in the city is -29°C (-21°F) [Jan 21, 1984]; the record low maximum is a relatively balmy -20°C (-4°F) [Jan 19, 1994]. The usual window for Freezing Temperatures is October 20 through to April 22.
Seasonally, the year is quite lopsided; October and November form a 2-month Autumn (more than half of which would be considered Winter in many other places), Winter is December, January, and February, and Spring, March and April – again with conditions that many places would consider Wintery. Summer conditions therefore start in May and last through September, or a full third of the year.
The record highs for the winter months are slightly on the cool side of shirtsleeve weather, like a building whose Air Con is turned up a little too high: 21°C (69°F), 19°C (67°F) and 21°C (70°F), respectively. Notice, too, that there is a clear midwinter month.
Usually, though, the warmest temperature of each month is much chillier: 12.4°C, 10.7°C, and 12.6°C (54.4°F, 51.2°F, and 54.6°F) respectively. Logically, most days are going to be cooler than this; the monthly average maximums are 2.3°C, 0°C, and 1.8°C (36.1°F, 32°F, and 35.2°F).
If you are going to have a monthly high that is 10°C or so warmer than the average, then you either have a day with a high that is 10°C cooler than that, or a number of days that are just a little cooler. The “44 days below freezing” quoted earlier argues in favor of the latter.
The usual lows are, -4.4°C, -7.2°C, and -6.1°C (24.1°F, 19.1°F, and 21°F), but there are times when the minimums drop to -14.8°C, -18.4°C, and -16.4°C (5.4°F, -1.2°F, and 2.9°F), respectively, or even colder – the record lows are -24°C, -29°C, and -29°C (-11°F, -21°F, and -21°F)!
Rainfall is moderate all year round, with a slightly wetter Summer than Winter. Thunderstorms are frequent, usually during Spring and Summer. At first glance, the annual rainfall patterns appear more complex than they really are, distorted by two factors: the shortness of February (as usual) and the fact that for most of the winter, most precipitation will occur as snow (which is counted separately).
More than 1 day in 3 but less than 1 in 2 will see rain to some degree throughout the winter. Despite this, January is the driest month, while February and March are almost identical when the former is corrected to a theoretical 30.5 days. December is slightly wetter again, and is the month with the greatest number of rainy days – 13.7, on average, which is getting awfully close to that 1 day in 2 number.
Snow typically falls in measurable quantities starting from November 15 and persisting through until April 4, but on rare occasions, the snow season can start as early as October, and on very rare occasions, can persist into May.
This paints a picture of a weather system that is usually stable, but which can occasionally veer into extreme instability. This impression is punctuated by the snowfall records: the norm is 108cm (42.5”), but the low is a mere 29cm (11.5”) in 1881-2 and the high a massive 241cm (94.9”) in 2013-14.
Despite these values, it’s rare for thick snow to be experienced at any given time; only 27.5 days a year usually have 7.6cm (3”) or more snow cover.
December usually sees 8.5 snowy days, January 10.4, and February 8.3 (which becomes almost 9 in a 30.5 day “month”). The average falls per snowy day are 2.9cm (1.14”), 3.1cm (1.22”), and 3.12 cm (1.23”), showing remarkable consistency. There is some suggestion that this is slightly misleading, and that the city experiences one winter storm depositing 6-9” of snow each year, but that this can occur at any point in the season.
During strong El Nino periods, Michigan usually experiences warmer than normal winter temperatures and reduced snowfall; the stronger the El Nino condition, the more pronounced the effects. The implication is that La Nina events will yield colder weather and heavier snowfalls. The interesting thing about these observations is that El Nino – La Nina is a PACIFIC OCEAN oscillation, while the Great Lakes connect to the Atlantic. The implication is that these events impact the Atlantic and that in turn impacts the Detroit weather, but I can’t state that as a definitive explanation, it’s just the best explanation I can come up with.
Cloud cover is a regular event during these months; December receives only 31% of the theoretically-available sunshine, rising to 41% and 47% in January and February, respectively. The “dark gray well” is often more traumatic and depressing than the snow and the temperatures. February also sees the coldest winds, sometimes described as “arctic blasts”.
Reactions To The Climate
You might get the impression that the climate is miserable, but the locals have acclimatized – “there are very few places in the lower 48 where winter is that unmanageable if you plan for it” writes one commentator; “most winters you would have had a lot of small snow events (2-3 inch storms) and several major storms (6-12 inch) storms and in some years really serious events like last year where blizzard conditions occur.”
But try telling that to the writers at The Thrillist, who ranked every state by how miserable their winters were, and placed Michigan 2nd worst (behind only Minnesota), writing,
“Winter in Michigan begins well before Thanksgiving and stretches far past Easter, which makes for four-to-six wearisome months of always-gray, always-cold, always-drizzly, but-rarely-snowy-in-a-good-way misery. Some other states may see colder temps or more snow, but Michigan winters are unrivaled for their utter lack of sunshine. The ceaseless cloud cover begins in October, and envelopes the state in a daily sense of gloom that only worsens when the apathetic sun slouches below the horizon at quarter-to-five.
“For the Michigander, this is winter: you leave work at 5 or 6, already in the dead of night, and fight your way down 94 or 96 or 75 or whatever Godforsaken stretch of highway. You can’t even tell if it is drizzling rain or snow, because the brown salt sludge that sprays up off the road coats your windshield more completely than anything that falls from the sky. Overnight, the road freezes. In the morning you wake up and it is still dark. You scrape off your car, then get stuck in traffic as the cars ahead of you gawk at the SUV that has slid into the ditch. You actually look forward to a proper snowfall, just to cover the dirt.”
Lawrence Ulrich of “The Drive” might agree; he selected Detroit as the worst city in America for winter driving:
“Bitter temperatures. Grim surroundings. Potholes upon potholes, another testament to the urban indifference of Republican Governor Rick Snyder, whose skinflint policies helped poison Flint’s water system. And, of course, snow and slush and that nasty stuff in between, like a dentist?s sandblaster aimed at your eyeballs.”
The introduction to “10 ways to survive a Michigan Winter” (by Kathleen Lavey, published in the Detroit Free Press) sums it all up fairly nicely, even if the publication date means that December is not included:
“A Michigan winter can be the best of times, with snow sports, snowmen and sleeping in on snow days.
“A Michigan winter can be the worst of times, with bone-chilling winds, drifts and dangerous driving.
“We’ve got most of January, all of February and much of unpredictable March to go. That means we could get 18 inches of snow (or equivalent rain), a flash of brilliant sunlight or days on end made dark by clouds.
“It’s predictably unpredictable.”
Activities or the lack thereof, II
Some sites complain that there are no real winter activities in Detroit. Maybe they’ve been under cloud cover for too long. Others paint a more positive picture.
There is a Thanksgiving Day Parade that is generally considered the first activity of the Winter Season, and a regular Christmas Spectacular at Radio City (the Fox Theater) featuring the famous Rockettes. The 110-room mansion at Meadow Brook Hall is normally opened for a Holiday Walk, and Holiday Lights are a big deal in Detroit, especially in three locations: the Wayne County Lightfest on Hines Drive, the Unger Family display in Royal Oak, and Dominos Farms in Ann Arbor.
Pre-Christmas, there is a Winter Market in Downtown Detroit, though this is a relatively recent addition. With 30 vendors spread over 4 locations, these are a relatively modest affair at present but could easily grow quickly.
But most winter activities take place on either the ice or the snow, some within the city boundaries, but many more elsewhere in the state; Michigan has 11,000 inland lakes and most will freeze sufficiently to permit ice skating.
Except that remarkably few locals take advantage of these opportunities. Remember those comments about the snow being more like a brown slushy? The dominant Detroit sport, at least at this time of year, is Ice Hockey, which shouldn’t surprise anyone, but it’s largely a spectator sport. Or, at least, that’s my impression.
Primary Sources:
- Wikipedia’s Detroit page;/li>
- MLive’s article about the Michigan weather for the 2017-18 Winter, El Nino a no-go this winter; What does that mean for Great Lakes winter“;
- Experience Detroit’s page, Winter Attractions & Things to Do;
- City-Data dot com’s forum page, “How bad it really becomes in winter (Detroit, Lansing Subdivision, living)“;
- Click On Detroit’s news article, “Michigan winters named 2nd ‘most miserable’ in the nation” by Ken Haddad, which reported and discussed the Thrillist article quoted;
- The Drive’s 2016 article, “Detroit Is America’s Worst Winter Driving City“.

Montage contents and credits:
- Chicago location map;
- Chicago community areas map (edited by Mike);
- Chicago Skyline Viewed from (what used to be known as) the John Hancock Center by Allen McGregor;
- The Willis Tower (then known as the Sears Tower) in 1998, by Soakologist;
- The Chicago Board Of Trade Building by Joe Ravi, usage CC-BY-SA 3.0 via Wikipedia;
- The Chicago River by Flickr user mindfrieze via Wikipedia;
- Navy Weir from the shoreline by David Bjorgen;
- St Mary of the Angels interior 090307 © 2009 Jeremy Atherton usage CC-BY-SA 3.0 via Wikipedia;
- Race and ethnicity map, Chicago 2010, modified by Mike for contrast.
15. Winter in Chicago
Like most people my age, I was introduced to the Windy City through the pages of fiction and the movies. A compound of a gleaming metropolis, the steelmaker of its nation, but in the harsh shadows lurked dark and sinister figures at every turn, or so it seemed. And like most perspectives generated from such source material, this view is three-quarters fanciful with a few nuggets of underlying historical truth.
Context Of The Industrial City
Chicago’s metropolitan center, known as the Iron Loop or simply “The Loop”, is noticeably bigger than that of Detroit, the other end of what I used to think of as the “Iron conveyor belt” – iron ore went in one end, and automobiles came out the other. Well, it’s been a long time since car bodies were made of steel (too heavy!) and the city had enough to do supplying girders for construction, anyway.
This is the largest city in the Midwest and third most-populated in the USA, with roughly 2.7 million residents as of the 2010 census.
Including the greater city area raises this tally to almost 10 million inhabitants of what is often called “Chicagoland” (note that there is no precise definition of just what “Chicagoland” does or doesn’t contain; it generally means the entire extended urban area. The term was coined by the Chicago Tribune who include the city, the surrounding county, eight nearby Illinois Counties and three in Indiana. The Illinois Department Of Tourism uses a different definition that excludes the city of Chicago itself, while the ‘Chicagoland Chamber Of Commerce employs a third that is somewhere in between the first two.)
Origins, Growth, and The Great Fire
Chicago was established as a Fur-trading outpost near a portage between the Great Lakes and the Mississippi River watershed, making it an important hub for trade. Rapid growth in the mid-nineteenth century (from 200 in 1833 to a million residents by 1890) led to the dominant use of timber as a construction material.
By 1871, more than two thirds of the structures in Chicago at the time of the fire were made entirely of wood, with most of the houses and buildings being topped with highly flammable tar or shingle roofs. All of the city’s sidewalks and many roads were also made of wood.
That year saw severe drought conditions – only 2.5cm (1”) of rain was recorded from July 4 to October 9.
The city was a tinderbox.
Numerous small fires and one large conflagration in the preceding week had been fought successfully by the Chicago Fire Department – 185 firefighters with just 17 horse-drawn steam engines to protect the entire city – which speaks to the intensity of the danger facing the city when fire broke out in a small barn belonging to the O’Leary family.
The exact cause of the blaze has never been determined – popular myth claims that Mrs O’Leary’s cow kicked over a lantern, but this was later established to be a fabrication deriving from anti-Irish sentiments directed toward Mrs O’Leary. An amateur historian suggests that the man who first reported the fire may have started it accidentally while attempting to steal milk, but others are unconvinced by this attempt to embed a grain of truth into the popular myth. There have also been claims that a group of men were gambling within the barn and accidentally knocked over a lantern, while still other suggestions point at the other recent fires and speculate on one or more common causes.
The situation on October 8 was compounded by a litany of errors. Although the initial response by the fire department was quick, they were sent to the wrong location, allowing the fire to grow unchecked. A second alarm sent from nearby failed to register at the courthouse where the fire watchmen were, and the firemen themselves were exhausted.
Factor in the weather situation and the prevalence of extremely-flammable timber, and conditions were right for a small barn fire to escalate into a major conflagration. But even then the damage would have been contained, in all likelihood, were it not for the presence of strong southwest winds that carried burning embers toward the heart of the city.
When firefighters finally arrived, the fire had spread to neighboring buildings and was progressing towards the central business district. Any hope of extinguishing the blaze was gone; firefighters could only hope to contain it, with the South Branch of the Chicago River and an area that had previously thoroughly burned to act as a natural firebreak – if luck was with them.
It wasn’t. The river was lined with lumber yards, warehouses, coal yards, barges, and numerous bridges across the river. When the wind intensified and became super-heated, it began causing structures to catch fire from the heat and from burning debris blown by the wind. Around 11:30 pm., flaming debris blew across the river and landed on roofs and the South Side Gas Works and began moving rapidly toward the heart of the city.
The firemen did their best, nevertheless, but a short time after the fire jumped the river, a burning piece of timber lodged on the roof of the city’s waterworks. Within minutes, the interior of the building was engulfed in flames and the building was destroyed. With it, the city’s water mains went dry and the city was helpless.
Late into the evening of the 9th, the fire started to burn itself out, and it finally started to rain. No survey to establish the damage was possible for several days, so hot were the smoldering ruins.
Ultimately, the fire was found to have covered an area of more than 2000 acres (809 ha) and to have consumed more than 117km (73 miles) of roads, 190km (120 miles) of sidewalk, 2,000 lampposts, 17,500 buildings, and $222 million in property – about a third of the city’s value at the time, and about 4 billion dollars in 2016 currency.
One-third of the city’s 300,000 residents were suddenly homeless. 120 bodies were recovered but the death toll may have been as high as 300; the county coroner found an accurate count to be impossible, as some victims may have drowned or had been incinerated, leaving no remains.
Almost immediately, the city began to rewrite its fire standards, spurred by the efforts of leading insurance executives, and fire-prevention reformers. (Somehow the response reminds me of the tale of the Three Little Pigs).
It’s my personal opinion that the fire’s legacy had a profound and lasting impact that now manifests in the architecture of the city. They embraced brick, and then steel – materials that wouldn’t burn – and embedded an architectural style into the culture of the city that has outlasted the memory of its origins.
The explosion in Racial Diversity
The construction boom accelerated population growth throughout the following decades, and by 1900 Chicago was one of the five largest cities in the world. The boom started by incorporating neighboring townships between 1851 and 1920, with the largest growth from this source taking place in 1889, when 5 townships merged with the city, including the areas that now comprise most of the “South Side Of Chicago” and “Chicago’s Northwest Side”.
The flourishing economy that both drove this expansion and resulted from it attracted huge numbers of immigrants from both Europe and the Eastern US. By 1900, 77% of the population were either foreign-born or had foreign-born parents. Of these, almost 2/3 were German, Irish, Polish, Swedish, or Czech. 98.1% of population was white.
Growth, especially rapid growth, inevitably produces growing pains; in Chicago’s case, they took the form of labor conflicts, such as the rather dramatic Haymarket Affair (also known as the Haymarket Massacre or Haymarket Riot), in which a peaceful rally held in support of an 8-hour working day and in reaction to the killing of several workers the previous day by police escalated into a violent confrontation following police attempts to disperse the gathering and the throwing of a dynamite-based bomb at the lawmen.
The blast and ensuing gunfire resulted in the deaths of 7 police officers and at least 4 civilians, with scores of others injured. Eight anarchists were subsequently convicted of conspiracy on the basis that one of them may have built the bomb.
The identity of the bomber was never conclusively proved. There is some suspicion that it may have been Rudolph Schnaubelt, the brother-in-law of one of the conspirators (who was later proven to have been addressing a completely different rally at the time of the bombing but who was found guilty anyway).
Seven were sentenced to death and the eighth to 15 years in prison. Two of the death sentences were subsequently commuted to life imprisonments and a third prisoner on death row committed suicide rather than face the gallows. The other four were hanged in November 1887.
The sentencing provoked outrage from labor and workers’ movements and their supporters, resulting in protests around the world, and elevating the defendants to the status of martyrs, especially abroad. Domestically, however, the press portrayed the anarchists as bloodthirsty foreign fanatics, polarizing public opinion against foreigners and strikers, despite the lead investigator of the case being dismissed from the police force for allegedly fabricating evidence in the case (he was reinstated 5 years later after the furor had died down).
Fifteen years later, the injustice perpetrated on what was clearly a politically-motivated show trial led to the surviving defendants being pardoned by the newly-installed Governor of the state, John Peter Altgeld, who called them victims of “hysteria, packed juries, and a biased judge”, and also faulted the city administration of the time for failing to hold Pinkerton guards responsible for repeated use of lethal violence against striking workers.
But though the violence may have died down, the battle lines had been drawn between the labor force and city officials, and would periodically erupt in industrial activism or strike action.
Lest the city government be unfairly characterized as repressive, over the next twenty years the city was recognized nationally as the leader of a movement to improve public health. City (and, later, state,) laws were both passed and enforced that upgraded standards for the medical profession and fought urban epidemics of cholera, smallpox, and yellow fever. These laws became templates for public health reform in other cities and states.
By now, Chicago had become the center of the nation’s railroad industry; by 1910 more than twenty railroads operated passenger services out of six different downtown terminals. The influence of the city can be clearly seen by the 1883 standardized system of North American time zones which is still in force today, developed because Chicago’s railway managers needed a general time convention in order to schedule and coordinate services.
During World War I and the 1920s there was a major expansion in industry. The availability of jobs attracted African-Americans from the Southern United States. Between 1910 and 1930, the African-American population of Chicago increased dramatically, from 44,103 to 233,903.
Of course this had a tremendous cultural impact, now called the Chicago Black Renaissance; but more importantly, these new workers had their own social axes to grind, and the existing tensions between industry and workers gave them an outlet for their frustrations, which had been exacerbated by social conditions and competition within the different racial factions for jobs and housing, and permitted to fester by police neglect of the situation.
The situation boiled over into turmoil following the death of an African-American youth who had accidentally drifted into a swimming area at an informally segregated beach. This triggered a melee that blew up into days of violent unrest, made still worse by a game of brinkmanship between the mayor of the city and the State Governor; the former steadfastly refusing to turn out the National Guard to quell the violence even though the latter had mobilized them to the city, where they were ready and waiting to intervene. The mayor was convinced that the trouble was Labor-related and not Race-related; nearly one-third of the African-American employees were non-union, had been used by management as strikebreakers in earlier years, and were resented by union employees as a consequence.
Sections of the Chicago economy were shut down for several days during and after the riots, since plants were closed to avoid interaction among bickering groups. By the time peace was restored, 38 people were dead (23 black and 15 white) and over 500 injured. Of course, this was only one event amongst approximately 25 riots during what is now sometimes named “Red Summer”.
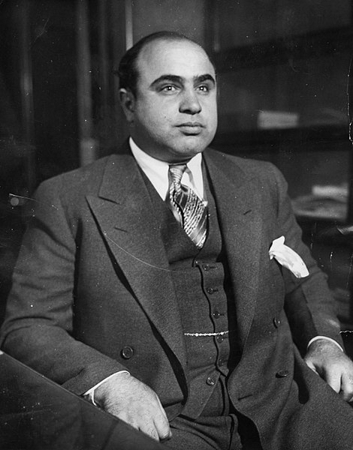
Al Capone in 1930
Because of the violence, a significant percentage of the black residents relocated, especially to Detroit.
Crime Capital?
Even as frayed tempers were cooling, the 18th amendment was being ratified, and Prohibition became the law of the land. This his ushered in what is known as the Gangster Era, a time that roughly spans from 1919 until 1933, when the law was repealed.
The 1920s saw gangsters, including Al Capone, Dion O’Banion, Bugs Moran and Tony Accardo battle law enforcement and each other on the streets of Chicago. perhaps the most notable event of the gangland wars nationwide took place here, the 1929 St Valentine’s Day Massacre.
Mafia groups had limited their activities to prostitution, gambling, and theft until 1920, when organized Bootlegging erupted in response to the “dry” laws. A profitable, often violent, black market for alcohol flourished. Prohibition provided a financial basis for organized crime to flourish.
To quote from Wikipedia’s page on Prohibition,
In a study of more than 30 major US. cities during the Prohibition years of 1920 and 1921, the number of crimes increased by 24%. Additionally, theft and burglaries increased by 9%, homicides by 12.7%, assaults and battery rose by 13%, drug addiction by 44.6%, and police department costs rose by 11.4%. This was largely the result of “black-market violence” and the diversion of law enforcement resources elsewhere. Despite the Prohibition movement’s hope that outlawing alcohol would reduce crime, the reality was that the Volstead Act led to higher crime rates than were experienced prior to Prohibition and the establishment of a black market dominated by criminal organizations.
…”Stronger liquor surged in popularity because its potency made it more profitable to smuggle. To prevent bootleggers from using industrial ethyl alcohol to produce illegal beverages, the federal government ordered the poisoning of industrial alcohols. In response, bootleggers hired chemists who successfully renatured the alcohol to make it drinkable. As a response, the Treasury Department required manufacturers to add more deadly poisons, including the particularly deadly methyl alcohol”…
“As many as 10,000 people died from drinking denatured alcohol before Prohibition ended. New York City medical examiner Charles Norris believed the government took responsibility for murder when they knew the poison was not deterring people and they continued to poison industrial alcohol (which would be used in drinking alcohol) anyway.”
The more you read about the impact that was felt, the more repercussions you observe influencing American life even today.
- There was an increased acceptance of women drinking in the semi-public speakeasies, unifying them as a perceived marketing demographic for the first time. Many found their way into the Bootlegging industry themselves, discovering that they could make a living by brewing or selling alcohol. This was an important step on the road towards gender equality, and prepared many for the role they would play in the factories as workers and ‘foremen’ during WWII. It was also a step along the road to the social acceptance of women owning and running their own businesses.
- Prohibition destroyed the fledgling wine industry in the USA. Wine-quality grapevines which were just becoming productive were replaced by lower-quality vines that grew thicker-skinned grapes, which could be more easily transported. Institutional knowledge was also lost as winemakers either emigrated to other wine-producing countries, or left the business altogether. Only today, almost a century later, is the industry beginning to recover.
- American tastes changed. Distilled Spirits became more popular, partially because it was easier to transport than the bulkier (and lower alcohol-content beer and fermented wine), it became common to mix and dilute the hard alcohol.
- Loss of life as a consequence of the laws and policies enacted to support them had a substantial social impact that remains difficult to quantify. Families were torn apart by alcoholism that might have been mitigated or better managed, given the presence of support agencies that also vanished with the Volstead Act. In consequence and recognition of the social shortfall, a new support structure, Alcoholics Anonymous, was created in 1935.
- The speakeasies promoted other forms of cultural change, and in particular, Jazz. This laid some of the foundations for what would become Rock’n’Roll, upon which most modern music is at least partially founded.
- When Prohibition ended, organized crime had grown accustomed to the easy profits and social power that wealth produced. Some groups from the next generation turned to the smuggling and distribution of illegal drugs as a substitute, and gained so much wealth and power as a result that they came to dominate any who resisted – at least, if Goodfellas is to be believed. This website certainly gives the impression that the heart of the plotline is correct.
- And, of course, if anyone exemplifies the corruption of public officials and politicians, it is the notorious Al Capone.
Modern Chicago
Which brings us back to Modern Chicago, a hub for finance, commerce, industry, technology, telecommunications, and transportation that is international in scope. O’Hare International Airport is the second-busiest in the world by air traffic. Oh, and just to spike one more misconception: the city has one of the world’s largest and most diversified economies, with no single industry employing more than 14% of the workforce.
In 2016, Chicago hosted a record 54 million domestic and international visitors, making it one of the most visited cities in the United States.
Winter In Chicago
The story of Chicago would not be the same without the presence of Lake Michigan to the northeast of the city. Aside from the obvious historical, shipping, and economic impacts, the lake functions as a climate moderator, making waterfront neighborhoods slightly warmer in winter and cooler in summer.
The city is officially regarded as having a humid continental climate with four distinct seasons. Spring is wet and cool; Summer is hot and often humid; Autumn is considered pleasantly mild; and Winters are cold and snowy with few sunny days. Rainfall peaks in May/June and is at its lowest in January/February. The normal January high is just below freezing.
Chicago is known to experience winter cold waves and summer heat waves that can last for several consecutive days.
Like other major cities, Chicago experiences the urban heat island effect (which I discussed under New York City in part 2 of this series), making the city and its suburbs milder than surrounding rural areas, especially at night and in winter. Another effect of the urban heat island is to reduce rainfall in the area subject to the thermal differential, producing a commensurate increase in rainfall downwind of the Urban center.
It should be noted that most of the city’s overall weather data stems from O’Hare airport, which is not subject to either of these adjustments – so the GM using Chicago as a location should correct for both the influence of Lake Michigan and the Chicago heat island.
The lowest official temperature of -33°C (-27°F) was recorded on January 20, 1985, at O’Hare.
As usual, having looked at the overall ‘picture’ of the season, let’s dig into the actual weather data provided, in this case, by Wikipedia.
Winter is quite distinctly December through February, though both Spring and Autumn can be quite chilly. The latter season is arguably only two months long, making room for a longer summer. Record highs for these months are 22°C (71°F), 19°C (67°F), and 24°C (75°F). So, on rare occasions, you may be comfortable in a short-sleeved shirt, despite the season – if there is no wind-chill.
Which reminds me, readers should be aware of the impact of Wind-chill and how to apply it. In a 2014 article, I provided Wind-chill tables as a free download and a game mechanics infrastructure for using it – get it from A strong wind blows: Environmental effects for RPGs if you haven’t done so already.
Anyway, getting back to it: Winter in Chicago proves quite variable. The usual daily high during this time of year is 1.6°C (34.8°F), -0.6°C (31°F), and 1.8°C (35.3°F), respectively by month, and the average of the hottest recorded days of each month – 12.8°C (55°F), 10.8°C (51.4°F), and 13.6°C (56.5°F) – shows that any given day can be hotter or colder by roughly ±10°C (20°F) in December and January and ±9°C (16°F) in February.
The daily lows are more attention-getting; the records each month are -32°C (-25°F), -33°C (27°F), and -29°C (-21°F), respectively. The nights in March continue to be cold, too: -24°C (-12°F), only marginally warmer.
Fortunately, such bitter cold is rare. The normal daily lows are -6.3°C (20.7°F), -8.6°C (16.5°F), and -6.6°C (20.1°F), respectively by month; the average of the coldest recorded nights of each month are -17.8°C (-0.1°F), -20.9°C (-5.6°F), and -17.9°C (-0.3°F); and the combination shows that any given night can be hotter or colder by ±11.5°C (20.7°F) in December, ±12.3°C (22.1°F) in January, and ±11.3°C (20.3°F) in February.
Winter temperatures can vary tremendously within the span of one week. Temperatures drop to or below -18°C (0°F) on 5.5 nights annually at Midway and 8.2 nights at O’Hare, and up to 10-14 nights in some far western and northern suburbs, although subzero (°F) readings in the absence of snow cover are rare. There have been streaks of multiple winter seasons without a single subzero reading, and there have also been winters with 20 or more subzero readings.
Winter is the “dry” season (if snow is disregarded), as expected. 57.2mm (2.25”) over 11 rainy days is normal for December, 43.9mm (1.73”) over 10.5 days in January, and 45.5mm (1.79”) over 8.8 days in February (which corrects to comparable values of 49.1mm or 1.9” over 9.5 days).
Snow has been recorded as early as October and trace falls as late as May, but the serious falls start in late November or December, when 20.8cm (8.2”) (and note the change in unit) is typically recorded from 6.9 snowy days. January receives 27.4cm (10.8”) on average over 8.2 snowy days, and February 23.1cm (9.1”) over 5.9 days, which corrects to comparable values of 24.9cm (9.8”) over 6.4 days – so falls come less frequently but are heavier, late in the season. It continues to snow noticeably in March – 14.2cm (5.6”) over 4.2 days.
Seasonal snowfall in the city has ranged from 24.9cm (9.8”) in 1920-21 up to 228cm (89.7”) in 1978-79. The average annual snowfall in Chicago is 91cm (36”).
Most winters produce many snow falls during the season in light accumulations of around 2 in (5.1 cm). Cities on the other side of Lake Michigan usually receive more snow than Chicago because of the lake-effect snow (produced when a cold air mass moves across long expanses of warmer lake water, warming the lower layer of air which picks up water vapor from the lake, rises up through the colder air above, freezes and is deposited on the leeward (downwind) shores) that falls on these communities, even though northeasterly winds can sometimes bring lake-effect snow to Chicago area too.
Every three years or so during the winter Chicago experiences a heavier snowstorm that can produce over 25cm (10”) of snow over a 1- to 3-day period, a level of snowfall very often seen in cities on the “snowbelt” on other side of the lake.
Cloud cover in these months is common, though not as gloomily monotonous as in nearby Detroit. In November, 38% of the theoretically possible sunshine is actually experienced, falling to 37% in December, and rising to 46% in both January and February. In fact, November averages just 3.8 hrs of sunshine a day, and December a gloomy 3.4 hrs.
All this paints a very different picture to that of Detroit, even though it is geographically extremely close to Chicago – 375km (233 miles) as the jet flies. That’s only 40% or so of the distance between Sydney and Melbourne, and half the air distance between Sydney and Brisbane (ironically, by road, the first trip is shorter than the second).
Winter Activities, Chicago Style
Chicago hosts a number of attractions, some of the best of which are to be found indoors, while those outdoor attractions that are to be found often go that extra mile to make it worthwhile braving the cold – suitably bundled in warm clothing, of course.
Nevertheless, Chicago is often considered a Summer destination; the snow is rarely thick enough for serious Snow Frolicking and the slopes – those there are – are extremely gentle; there is just enough of it to be uncomfortable.
Chicago natives themselves use the description “Urban Hermits” to describe their preferred reaction to sub-zero temperatures, preferring nothing better than “snuggling in for a Netflix binge with a bottle of wine” and presumably a heater!
Since this is the off-peak season for tourism, a lot of usually-crowded attractions are relatively accessible, and many offer discount entry fees. This includes, in no particular order:
- The Art Institute of Chicago (the Lions out front wear festive wreaths in the holiday season);
- The Field Museum (which has spectacular Dinosaur and Mummy exhibits);
- The Museum of Science & Industry (a German submarine, replica coal mine, and the Apollo 8 spacecraft exhibits, amongst other features); in December, they traditionally feature a seasonal “Christmas Around the World” exhibit featuring dozens of trees, decorated to represent a unique culture.
- The Shedd Aquarium, with a famous Shark Exhibit that permits visitors to get closer than is really comfortable for most;
- The Ford Oriental and Cadillac Theaters, which host Broadway productions, many seasonally-themed;
- The Chicago Theater, which hosts a more diverse set of entertainments including plays, concerts, and comedy shows;
- The Tivoli Theater, which is a restored venue and traditionally presents holiday classics such as “A Christmas Story,” “Christmas Vacation,” and “White Christmas”, always preceded by a singalong lead by the Theater’s Wurlitzer Pipe Organ.
- The John Hancock Observatory not only offers famous views of the city such as the Skyline view included in the Montage above, it also contains the highest ice-skating rink in the world on the 94th floor, a full 1000′ into the air. The skating season typically starts in early January and ends in April.
- The Kane County Flea Market in St Charles contains a variety of vendors of Antiques and collectibles. Although it runs all year, this is the season when they aren’t swarmed under with casual antiquers.
- The Hollywood Casino is a riverboat located in Aurora, about an hour from Downtown Chicago, about as far out of the CBD as I am, in other words! Slot machines, a poker room, several dining choices, and live entertainment.
- If you prefer to stand on solid ground when you gamble, the Grand Victorian in Elgin might be more your speed. It’s a riverfront Casino in the Chicago suburbs about 45 minutes from the City, with slot machines (of course), table games, and a number of dining and entertainment choices.
- Remember what I said about Snow Frolics? Swallow Park in Palos Park has a hill and usually sufficient snow cover for sledding. The area used to be famous for its Toboggan slides, but they were demolished a few years ago – but the huge hill on which they stood remains. There are several other locations that offer similar opportunities in the Chicago Hills.
- The Little Red Schoolhouse in Willow Springs is surrounded by miles of Wooded Trails and also contains a state-of-the-art Nature Center. Closed only on Thanksgiving, Christmas Day & New Year’s Day, each season presents a different naturescape for the hiker willing to look for it.
- The Adler Planetarium is one of the best in America, with exhibits and incredible shows in the Grainger Sky Theater.
- Chicago is a city that revels in it’s history. There are at least 31 “Gangster/Crime/Prohibition” themed tours – I got that many listed from the single reference cited – plus a handful tours that focus on the Great Fire, and any number of more generic historical tours. Plus the museums, etc! Most of these are open all year round, but as with many other attractions, the peak lies in the Summer Months, so expect considerably less crowding at this time of year, and possible discounts aimed at wooing customers.. On the other hand, costs per tourist may be higher in Winter so it’s possible that you’ll pay an off-season premium.
On top of that, there are many many more seasonal events and attractions, mostly in December:
- The city has a number of parks that have been preserved from the encroachment of construction, and some of them such as Millennium Park are popular for Ice Skating.
- In addition to the famous shopping experience offered by the “Magnificent Mile” of Michigan Avenue, November offers the Magnificent Mile Holiday Lights Festival, which includes a parade, concerts, and a fireworks show over the Chicago River.
- Chicago’s Thanksgiving Day parade may not have the fame or cachet of that of the Macy’s Parade in New York City, but the event – now sponsored by McDonald’s – still runs down State Street from Congress to Randolph to packed crowds.
- That is followed by the Lincoln Park ZooLights Festival, a display of over 2 million lights, held annually each year at Chicago’s beautiful Lincoln Park Zoo, a free event that features multiple themed activities including ice carving demonstrations, carolers, and a synchronized music and light show. And, of course, vendors offering warm drinks, etc.
- The Hollywood Blvd/Palms Cinema is a unique dinner & movie theater concept located in the Chicago suburbs who frequently offer special celebrity hosted events, including meet and greet nights.
- Brookfield Zoo, 20 minutes outside the city, holds a “Holiday Magic” celebration every year. In addition to the usual activities and exhibits – an underwater polar bear viewing area, a dolphin show, and an indoor primate area being highlights – the “Holiday Magic” includes over a million dazzling LED lights festooning the Zoo, Christmas Carols, Santa visits, Holiday treats, and ice carving.
- The Scenic horse drawn carriage rides which travel the streets of downtown Chicago operate year-round, but the winter displays of Christmas Lights adds a popular seasonal touch.
- The Navy Pier is an amusement park built on an actual working pier – which is to say it’s accessible by both land and sea. In addition to all its usual attractions, which operate all year round, they host an annual “Winter Wonderfest” event, complete with ice skating, live entertainment, rides, and more.
- Christkindlmarket is a traditional “German shopping village” – i.e. an annual free outdoor market featuring vendors hand-crafted ornaments, toys, and unique holiday gifts from around the world as well as traditional German foods, sweets, and beverages. It has been a seasonal attraction in Chicago for 22 years, includes special events, performers, and activities, and – to be honest – is beginning to outgrow the available space. One of the most popular Chicago Winter attractions, it can be tightly-packed in warmer weather.
- In a similar vein is the Randolph Street Market Festival, where 200+ vendors hawk antique housewares, furniture, ephemera, clothing and more. While it adds an outdoor area for even more shopping and beer garden during the warmer months, the main festival is indoors, usually held on the last weekend of each month all year round.
- New Year’s Day this year was a little different to those of recent times. There were the usual Concert Events, the standard Parties, the anything-but-routine but still expected dinner specials, but one free attraction that usually brings in the big crowds didn’t happen: the rising of the giant star up the side of a Hotel in Chi-Town and the Loop, with a concert and fireworks – sort of a more triumphant version of the Times Square event in NYC.
January – because of the weather – is notoriously a slow month for events in Chicago. That’s one reason why there are so many December events – the weather hasn’t turned truly nasty yet. But February is busier.
- Once the hangovers have cleared, mid-January brings the Tomorrow Never Knows annual music festival which for five days focuses on rising bands, local acts, and comedians. But this and the New Year’s celebrations are the only notable events in the first calander month of each year.
- February kicks off with the Chinese New Year celebrations, as vibrant and exuberant here as anywhere with a significant Chinese population.
- Toward the end of February, the Chicago Auto Show is an annual showcase with close to 1000 vehicles on display at the 2018 edition.
- Overlapping with the Auto Show is the Chicago Black Restaurant Week, recognizing another of the cultural transformations that took place with the Black Influx at the start of the 20th century.
- Around the same time is the “Hump! Film Festival”, an annual screening of homemade amateur short porn films. This has grown into a celebration of sexual diversity that deliberately confronts all comers regardless of orientation.
- And the same weekend in 2018 also sees the 5th annual Cider Summit Chicago. SBS Imports and the Seattle Beer Collective are taking over the Grand Ballroom in Navy Pier and filling it with more than 140 ciders from throughout the US., Scotland, France, Spain, England and New Zealand.
- Not to be left out in the cold, the following weekend brings the fourth annual Frost Fest, an outdoor party at which attendees who dare brave the cold will be able to sample more than 50 craft beers from local breweries in a gigantic heated tent during three separate three-hour tasting sessions, all while surrounded by live music and food from local restaurants.
But none of these are the biggest Chicago draw of them all.
Some cities are just naturally sports-oriented. Sydney’s a bit like that, and so is Melbourne; it is sometimes said that we’ll watch anything that involves two or more players and a uniform of some kind; balls optional. Personally, I think speed chess might struggle to find a TV slot, but over the years we’ve seen just about everything else.
Chicago is exactly the same. One of the few cities represented in every major sporting franchise in North America, from Ice Hockey to Football to Basketball to Baseball to Field Hockey to (Google Search, Google Search)… yes, there is a Chicago Soccer Club and a Cricket League with 20 teams and 400+ players. And an internationally-known squash tournament. And a Badminton league… (I couldn’t find a Darts Championship. Next week, that may have changed – they have just about everything else.
You don’t get so many teams without two things: players at the grassroots to produce the players, and an audience that will pay to watch them. With so many sports on offer, there is virtually ALWAYS something to watch.
I’ve never been to Chicago but I feel like I know them already – and see them, or a people very much like them, every time I set foot out my door.
Primary sources:
- 50 fun things to do this winter in Chicago! by Maureen Therese from Top Ten Travel Blog;
- Things to do in Chicago this winter when you’re not hibernating by Grace Perry for Time Out, and several subsidiary pages;
- Yelp.com.au’s page, Top Gangster Tours in Chicago.
(I also checked a number of other sources without adding significantly to the list of events).

Omaha Montage Contents, Notes and Credits:
- Omaha Location map;
- Downtown Omaha viewed from the Heartland Of America Park in April 2006, photo by Raymond Bucko, SJ via Flikr and Wikipedia, Usage CC 2.0 Generic License;
- Office Buildings in downtown Omaha by Collinulness;
- The Hotel Fontanelle, demolished in 1983, from a postcard held by the Omaha Public Library (Note that this image might still be copyright in some locations included Canada, Germany, and Switzerland – refer this usage licensing page;
- The Roman L Hruska Federal Courthouse, viewed from the west by JohnClee86;
- The First National Tower in Omaha by Collinulness;
- The Desert Dome at the Henry Doorly Zoo and Aquarium by Collinulness;
- Inside the TD Ameritrade Park, Omaha, by Collinulness;
- 091407-Joslyn Castle by Bobak Ha’Eri – The home of George and Sarah Joslyn, officially named “Lynhurst,” but known locally as Joslyn Castle), built in 1903, now a local venue, historic building, and tourist attraction.
- Lauritzen Gardens (formerly Omaha the Omaha Botanical Gardens) by Kristine Paulus via Flikr, usage by CC Attribution 2.0 Generic License;
- Photo of Union Pacific 9043, a 4-12-2 locomotive, pulling freight near Omaha in 1929 by Bob Fremming-Dallas, Wisconsin, considered to be in the public domain as it was published in the USA between 1923 and 1977 without a copyright notice. Usage rights may be restricted elsewhere including Canada, refer this usage licensing page.
16. Winter In Omaha
Nebraska is pancake-flat, freezes solid in winter, and is a place that never changes – at least if the limited exposure of the state to international media is accurate. One of the purposes of this series is to replace supposition, conjecture, and misconception with accuracy, so let’s look at some facts.
Omaha is the largest city in the state of Nebraska and located in the county seat of Douglas – except that it isn’t, really; the city has spread south beyond the county line, extended a tendril north to the county line (because the Glenn Cuningham Lake Campground is considered part of the city), and – to all intents and purposes – the townships in Iowa adjacent to the section of the Missouri River occupied by the city – should really be considered suburbs of the city at the very least. Is Council Bluffs, Iowa, directly connected to central Omaha by the 480, really a completely separate and distinct community?
Certainly, the Omaha Chamber Of Commerce doesn’t seem to think so. Who am I to argue? So let’s just say that it’s a city most lies in Nebraska, on the Western Bank of the Missouri, and move on.
A potted social and economic history
The city was, in fact, founded by speculators from Council Bluffs, and a crossing called Lone Tree Ferry gave it the nickname, “The Gateway To The West”.
Omaha declared itself to the world when it hosted the 1898 World’s Fair, dubbed the “Trans-Mississippi Exposition”. By this time, its central location had caused it to become an important transport hub, and in the 20th century, it’s meatpacking plants became internationally prominent.
In fact, a several prominent businesses can be said to have either begun there, or have their headquarters there: Four Fortune 500 companies and 5 Fortune 1000 companies, including the mega-conglomerate Berkshire Hathaway, headed by “local investor” Warren Buffett (to use the description provided by Wikipedia). Union Pacific, the largest railroad operator in the US is headquartered there, and so is the First National Bank of Omaha, which few will have heard of, but which is the largest privately-held bank in the US. So are three of the 10 largest architecture/engineering firms in the country, and the internationally famous market research firm, Gallup. Enron started in Omaha as Northern Natural Gas.
Omaha has given the world a number of important technological and cultural developments (and a few less important but historically-relevant ones, as well): the Bobby Pin and “pink hair curler”; Cake Mix; Center-Pivot irrigation; Raisin Bran; The Ski Lift; The “Top 40” radio format; and the TV Dinner.
Many historic buildings have been demolished and the land redeveloped; it simply happens at a slower pace than larger cities, where new construction projects begin as soon as another breaks ground.
Take, for example, the Hotel Fontanelle. An upmarket hotel which opened in 1915 and became the center of Omaha society, the site of numerous civic events, weddings, and conventions. In 1920, it was acquired by Gene Eppley and became the flagship of the Eppley Hotel Company, which operated 22 structures in six states, the largest privately held hotel company in the US. Eppley himself resided within from the time of the purchase until his death in 1958, two years after he sold his entire hotel empire to Sheraton Hotels, the second-largest hotel sale in US history. Sheraton operated the hotel until 1968, when it was sold and once again operated as an independent source of accommodation. But Omaha had grown westward, and as a result of the shifting demographics and aging construction, it faded from popularity, closing in 1970. Over the next 13 years, numerous attempts were made to redevelop the Fontanelle, but none were successful; finally, it was demolished in 1983, becoming the parking lot of the planned Federal Courthouse (which was completed and Dedicated in the year 2000).
Not all the history is so uplifting. In 1900, Omaha was the center of a national uproar over the kidnapping of Edward Cudahy, Jr., the son of a local meatpacking magnate, and the early 20th century also saw significant civil unrest.
The city’s labor and management clashed in bitter strikes, racial tension escalated as blacks were hired as strikebreakers, and ethnic strife broke out. A major riot by earlier immigrants in South Omaha destroyed the city’s Greek Town in 1909, completely driving out the Greek population. Only six year later, like Chicago, Omaha was caught up in the Red Summer riots when thousands of whites marched from South Omaha to the courthouse to lynch a black worker, Willy Brown, suspected in the alleged rape of a white woman; they burned the County Courthouse to get the prisoner, causing more than $1,000,000 damage. They hanged and shot Will Brown, then burned his body. Troops were called in from Fort Omaha to quell the riot, prevent more crowds gathering in South Omaha, and to protect the black community in North Omaha.
In the 1960s, three major race riots along North 24th Street destroyed the Near North Side’s economic base, with recovery slow for decades.
Nor was nature always kind;
The Great Flood of 1881 filled Omaha and Council Bluffs with water for almost a month, causing two fatalities and millions of dollars in damage. The Easter Sunday Tornado of 1913 destroyed much of the city’s African-American community, in addition to much of Midtown Omaha. As many as 1,000 people were displaced by a flood in 1943, and there was another in 1952 which led to 40,000 people being evacuated from East Omaha and Carter Lake. In 1975 another major tornado, along with a major blizzard, caused more than $100 million in damages in 1975 dollars
In 1989, Omaha gained the notorious designation of having demolished the largest-ever National Register historic district in the United States. The Jobbers Canyon Historic District, along the Missouri River, was felled for a new headquarters campus for ConAgra Foods, a company which threatened to relocate if Omaha did not allow them to raze the city’s historic district. The warehouses had been allowed to deteriorate and were the scene of several fires set by the homeless population that had come to live in the abandoned buildings, and at the time, there were no plans in place for revitalizing the buildings, a fact that was instrumental in the City’s decision.
To help place the decision in context, it must be acknowledged that throughout the 1980s and 90s, Omaha also saw several major company headquarters leave the city, including Enron and First Data Corporation, a large credit-card processor.
Public reaction was less favorably disposed toward the decision, and a push toward the preservation and restoration of historic structures resulted.
Economic infrastructure continued to depart the city for the rest of the 20th century despite all efforts at halting the slide. The history of the city over the latter half of that century is full of terms like “notorious” and “now-infamous” when describing corporate leaders of the time.
At the same time, continuous signs of economic recovery can be observed as far back as 1970; it simply took thirty years for the economy to turn around.
Around the start of the 21st century, several new downtown skyscrapers and cultural institutions were built, the first in an ongoing series of developments and redevelopments which have successfully renewed the fading vitality of the city.
All this is at odds with the popular perception of the city. Yes, good reader, Omaha has skyscrapers! It’s just that most of them aren’t very tall – certainly no real rivals to the towers of Steel and Concrete in New York City or Chicago.
The Topography
So, is Omaha really flat? The answer is yes – but it didn’t get that way naturally. There has been significant alteration of the natural topography, with substantial regrading throughout Downtown Omaha and scattered locations elsewhere all across the city. Minor land reclamation efforts coupled with the construction of dams further upstream have brought dozens of acres along the Missouri into usage. Many of the natural variations in elevation have been evened out by these processes.
The highest natural point in the city is Belvedere Point in North Omaha. The lowest is in East Omaha, which sits on a flood plain west of the Missouri River. East Omaha was also once the location of Florence Lake, which dried up at some point in the 1920s.
The Climate
Omaha is located a long way from moderating bodies of water or mountain ranges. The climate is often compared with that of Rome, Italy, which is at virtually the same latitude, but there are only about 25 minutes of arc separating Omaha and Chicago, or about 0.46% of the Northern hemisphere, which makes a comparison between those cities equally enlightening.
Officially, the city enjoys a humid continental climate, with hot summers and cold winters. This is exactly the same general classification as that of Chicago, so you would expect the two to have similar weather profiles.
July averages 24.8°C (76.7°F), with average relative humidity around 70% which then leads to relatively frequent, and often violent, thunderstorms, which are fully capable of spawning tornadoes. The January daily average is -4.7°C (23.5°F), with lows reaching -18°C(0°F) on 11 days each year. The lowest temperature recorded in the city was -36°C (-32°F) on January 5, 1884. Average yearly precipitation is 777mm (30.6”), falling mostly in the warmer months; what precipitation does fall in winter usually takes the form of snow, with average seasonal snowfall being 73cm (28.7”).
Based on 30-year averages obtained from NOAA’s National Climatic Data Center for the months of December, January and February, Weather Channel ranked Omaha the 5th coldest major US. city as of 2014.
Chicago’s record low is 1°F cooler, but in most respects, Omaha is 5°F or more cooler during this time of year. Now, I can’t speak for anyone else, but 1°C is a definitely noticeable change in temperature, and 5°F is just over two-and-three-quarters of them.
Omaha has a very pronounced summer and a fairly vaguely-defined winter, with very brief transitional periods. Depending on which climactic yardstick you use, Winter could start in November and last until March (record low, snowfall) or be a more typical December-to-February deal (average low, average high – with the caveat that sometimes you won’t be able to distinguish late fall / early spring from the colder season they bracket. It’s also possible to argue that Winter is December to mid-march, based on the record high temperatures.
Since there’s nothing about Autumn that says it can’t snow, and the same for Spring, I’m going to go with the “standard winter” (with caveats) model.
And so to specifics. The record highs for the winter months are, respectively 22°C (72°F), 21°C (69°F), and 26°C (78°F), but those don’t come along very often. The usual daily highs are 1.8°C (35.3°F), 0.8°C (33.4°F), and 3.4°C (38.1°F).
No data has been provided on the mean of the highest or lowest temperatures achieved in each month, which is useful in assessing the variability from one day to the next; observation of such data from other cities suggests that the high is a degree or two higher than the average of the “usual daily high” and the “record high” for each month, and the low is similarly a degree or two colder than the equivalent mean. So I would estimate these values (highs) as being approximately 13.9°C (57°F), 12.9°C (55.2°F), and 16.7°C (62°F), respectively. I will provide similar estimates for the lows below, without reiterating the explanation.
Understandably, the average number of days above 32°C (90°F) for this time of year is zero – in fact, Omaha only gets about 28 of them a year.
The record lows are -32°C (-25°F), -36°C (-32°F), and -32°C (-26°F) – with honorable mentions for November [-26°C (-14°F)] and March [-27°C (-16°F)]. Only three months of the year do not have a record low that is subzero. I once had an NPC describe the winter weather as “feeling like the arctic circle was just north of the border – any border in that general direction”. Admittedly, he was referring to conditions with a 60 km/h wind blowing, worth -50°C (-90°F) in Wind Chill!
The usual lows are -8.5°C (16.7°F), -10.2°C (13.6°F), and -7.7°C (18.1°F). I estimate that the temperatures on any given day could drop as low as -22°C (-7.6°F), -23.1°C (-9.6°F), and -19.9°C (-3.8°F).
Equally useful to know is how often this happens. October averages 4.9 days (presumably, actually, nights) below freezing; November, 19.1; December, 29.2; January 30.1; February 25.4; March 20.4; and April 6.5. Two-to-three times a decade, there will be such a day in May or September.
Rainfall in December is about 60% of the rainfall in November (26.4mm/1.04” down from 41.7mm/1.64”), and drops still further in January (18.3mm/0.72”), with February somewhere in between (21.6mm/0.85). The March figure is over 50.5mm, or more than twice the February value; adjusting Feb’s numbers to a roughly-equivalent duration is nowhere near enough to change this (23.3mm).
The number of rainy days does not change anywhere near so severely; this indicates that the intensity and/or duration of the rainfall is the primary variable. 6.7 days in November becomes 6.6 in December, 6 in January, 6.5 in February (7 adjusted), and 8.2 in March.
Of course, you can only consider these to be the dryer months if you ignore the white stuff on the ground. Snow is a reality for Omaha that is, however, difficult to ignore for very long.
Snow can fall (and has fallen) as late as April and as early as October. Less than half the year – five months – are historically, snow-free. Admittedly, the amounts for several of those months are relatively light; The average is for 0.2 Snow days in October yielding 8mm (0.3”), and November typically has only 2.2 snow days producing 6.4cm (2.5″). December sees more snow, but the falls appear to be no heavier, just more frequent: 4.7 snow days producing 15.7cm (6.2”) of cover. It’s much the same story in January – 4.6 snow days and falls totaling 15.5cm (6.1”) on average. In February, the falls become slightly lighter but slightly more frequent: 4.9 snowy days (despite the shorter calendar month) and exactly the same amount of snow as January, on average. If you correct these to be of comparable length to the other months – 30.5 days – you get 5.2 days (still essentially 1 day in 6) and 16.7cm (6.6”). Overall, more snow falls in this month than any other, per day. March has 2.5 snow days, and April 0.8 – so it is roughly four times more likely for Winter to linger than it is to come early, and perhaps once in a decade or two, you would hit the ‘jackpot’ and have both.
November and December are the cloudiest months, receiving 50% and 47% of the theoretically-available sunshine, respectively. In January, that rises to 56%, in February (more frequent snowfalls, remember) it drops back to 53%, in March it rises back to the 56% mark, and the remainder of the year receives 62% or more. But the gloomiest days are during the holiday season.
Things To Do In An Omaha Winter
Some cities avoid the gloom, others defy it. Omaha seems to be one of the latter.
Some attractions are open all year round, though special events may commemorate the season. Highlight choices that fall into this category include:
- The Lauritzen Gardens – tropical temperatures and plants, on demand, thanks to the 10,000 square foot “tropical house”, waterfalls, and pond, and the 5,300 square feet of the “temperate house”, plus a large indoor gallery for floral displays and special events. The diversity can be summed up by mentioning three more attractions at the Gardens: The Rose Garden, the Wetlands Route, and special exhibits at the Visitors Center which have included life-sized Lego exhibits.
- 36 minute’s drive out of the city center is the SAC Aerospace Museum in Ashland – 300,000 square feet of displays and exhibits including iconic cold way aircraft; the collection of space-related artifacts of Nebraskan Astronaut Clayton Anderson; an open-to-the-public flight simulator; and a planetarium. On top of all that, the Museum hosts special events and camps through the winter months.
- The Henry Doorly Zoo And Aquarium – This features an indoor rainforest, a desert dome, “cat complex”, “giraffe barn”, gorilla and orangutan houses, a Madagascar exhibit, and the butterfly house, plus the Lozier IMAX theater. The Aquarium is also indoors – so even if the outside world is hibernating there’s plenty to see here.
- The Old Market and Old Market Passageway are home to dozens of boutique shops, art galleries, and diverse options for a warm meal. One noteworthy location in the latter is Hollywood Candy, which boasts a wide range of “vintage” candy and soda flavors, including what some consider the world’s largest collection of Pez Dispensers. They also sell vintage LPs, etc, all in a Malt-Shoppe-inspired surround.
- The Joslyn Art Museum features numerous galleries, a sculpture garden, a concert hall, and a lecture hall, all in use throughout the year. “Among visitors? favorite exhibits is the Chihuly glass that hangs floor to ceiling on the second level of the museum. The museum?s permanent collection includes pieces from early Egypt to modern interpretations of everyday life. Special exhibits (which have an admission fee) have included King Tut artifacts, Andy Warhol art and a look at the Union Pacific Railroad.” writes The Walking Tourist.
- An hour out of the city is usually stretching it, but I couldn’t ignore Licorice International in Lincoln, which sells nearly 160 different types of licorice from 12 countries as well as other gourmet candies and foods.
- Also in Lincoln, while you’re there, check out The Escape Room, a “real-life adventure game” (sounds like a LARP to me, with the players playing themselves) – you need to solve puzzles, riddles, and clues in order to escape within the 60-minute deadline.
- And, to round out the day, Lincoln is home to the state’s largest outdoor Ice-skating rink (winter only, of course!).
- Again from Best Things Ne: “In recent years, the craft beer scene in Omaha has exploded and most of the breweries offer fantastic tours year-round. But you can also plan your own tour by requesting a Craft Brew Explorer’s Journal at the Visit Omaha website, and take a journey to eight breweries across Omaha where you’ll enjoy a complimentary beer at each! Bonus: if you can make it through all eight breweries, the Omaha Visit Center will have a complimentary pint glass waiting for you at the finish line.”
- Film Streams is a “quaint” theater in downtown Omaha that specializes in obscure and foreign films, from independents to classics.
- The North of downtown Omaha is the “arty” district that many cities have, and is full of art shops ranging from Photography to glass blowing.
- Durham Museum is more about local history, located at the site of the old Union Station depot. Although I haven’t really discussed it, this was a vital link in the settlement of the Western USA, so this is something for any History buff to revel in. The top level offers a look back at a depot in the early days. The lower level houses permanent and temporary exhibits. Among the permanent collection is a look at the 1898 Trans-Mississippi Fair and Native American life.
- The Children’s Museum is strictly for younger kids and is known as a place for them to burn off excess energy. Most of the exhibits are interactive, and many permit them to take real-life forms of “make-believe” to the next level – a grocery store area where kids can either “shop” or be “cashiers”, a mechanics garage, and scrap-booking.
- Joslyn Castle and its grounds are open for public tours, events, and private rental for private ‘special’ occasions. Winter may not be the best time to view the grounds, but there’s something very appropriate about touring something that looks like a castle when it’s cold and snowy out.
- It may be winter, but that won’t deter any serious Hiker. The Hummel Hike Club meets the first weekend of every month, seasons notwithstanding.
On top of that, there are a number of seasonal activities of particular note. In December:
- Early in the month, Pajama Night is held at the Union Pacific Museum from 5-7PM.
- The Lights Of Omaha – Some cities put on more of a show for Christmas than others. Omaha is one of the former: “the city comes to life with more than one million twinkling lights, family activities such as ice skating, and much more” according to Best Things Ne. The lights are switched on come Thanksgiving Night and stay lit for a month, signaling the annual Holiday Lights Festival, which features “live music, old-fashioned carolers, ice skating in the Old Market, Dancing Santas at the Symphony, the lighting of the official Christmas Tree, the traditional performance of A Christmas Carol, topped off with a beautiful fireworks display on New Year’s Eve that lights up the sky over the Heartland of America Park” (Official Blurb).
- Christmas at Union Station features the biggest indoor Christmas Tree in the Omaha Region. The Decorations are lit on the day after Thanksgiving, an event that draws thousands for the food and holiday-themed activities for children. The tree remains on display until the coming of the New Year. A number of other events, including an Ethnic Holiday Festival, Concert Series, exhibition about Christmas Trees and a Christmas-themed miniature display, have been folded into this broader occasion.
- In Early December for about 10 days, Sycamore Farms (in Waterloo, Nebraska) hosts Winter Wonderland. The century-old farmhouse and barns are festooned with lights and holiday decorations and hosts 70 indoor heated vintage vendors, makers, and artisans. Everything from Pony and Carriage Rides to Ice Sculpture live carvings and Classic Christmas movies. While this event has only been held once to date, 20,000 people registered their interest in attending, so it’s fairly safe to say that it will be an ongoing attraction henceforth.
But the two big events mentioned generally subordinate everything else for the month. In January:
- Things kick off with the New Years Fireworks Spectacular, the closing event of the Holiday Lights Festival.
- Winterfest At The Omaha Kroc Center – not to be confused with the other event called “Winterfest” listed in December, this is a strictly-for-kids event at the Salvation Army KROC Center, notably the location for a 2 1/2 story water-slide, the Stingray. (Water-slides and swimming in general are surprisingly popular activities in Nebraska, even though pools have to be indoors and heated or they will freeze solid).
- Mid-month, the SAC Aerospace Museum (see earlier) hosts an indoor air-show for remote-controlled models, with safety demonstrations and educational booths. Entry to the event is included in paid admission to the Museum.
- Late in January, the Cathedral Flower Festival draws more than 15,000 visitors to the historic St Cecilia Cathedral. Local florists transform thousands of varietals of flowers into works of art that decorate the cathedral space; special events are often scheduled during the run of the show.
- Also around this time of year, “Cold Day, Warm Hearts, and Family Fun” at the Owen Marina in Mahoney State Park is all about outdoor activities for the whole family such as Fishing, roasting hot dogs over an open bonfire, wintercrafts, and more. Admission is free to holders of a Park Permit, which is required for all attendees.
- And, at much the same time, the Omaha Children’s Museum holds its annual Star Wars Night.
- Martin Luther King Jr. Day in mid-January is a day of family-friendly volunteer activities throughout the city.
- Late in the month, a group of cinemas (collectively, the Marcus Theaters) present family-friendly movies as the “Kids Dream Winter Film Series”.
- Throughout January, the Omaha Public Library hosts a long list of children’s activities (some focusing on particular age groups e.g. Teens). This year there were 11, including one recurring item. Most events require registration.
And, in February:
- Groundhog Day is early in the month and the Union Pacific Museum has special events centered around Shadows and Groundhogs to celebrate.
- The Omaha Public Library holds still more events on the weekends.
- Valentine’s Day appears to be a big deal in this part of the world with more than 25 family-friendly events taking place in Omaha and surrounding townships throughout the first half of the month. Several of these involve making Valentine’s for others to give, such as Seniors and the residents of the Open Door Mission.
- Later in the month, there is a Draw-A-Thon for Teens at the Joslyn Art Museum, where attendees get to meet local artists, make art, dance, and eat pizza from 6:30PM until Midnight as they move through small-group art-making workshops in different areas of the Museum.
- For more than 30 years, the Figure Skating Club of Omaha (and the Edge Figure Skating Club) have co-hosted the Omaha Winter Festival (aka Winterfest), an annual competition that regularly attracts more than 200 competitors representing 20 clubs from a 7-state region. Every skater in a group receives an award (medal or ribbon) and gets to demonstrate their accomplishments to friends and family. Attendance is free and open to the public. This year the Festival will be held on February 22-25, and presumably the date would be similar (late February) every year.
The major sports in this part of the world are basketball (indoors) and Ice hockey, both played by college teams. Omaha has hosted the annual NCAA College World Series (men’s basketball) every June since 1950. The major local teams (and their sports) are the Creighton Bluejays (Men’s Basketball), the Omaha Storm Chasers (Baseball), Omaha Diamond Spirit (Summer Baseball), Omaha Lancers (Ice Hockey), Omaha Mavericks (Ice Hockey), Creighton Bluejays (Men’s Soccer), and the latest addition, the Omaha Pioneers. Omaha also has a history of success in Curling, having produced multiple junior national champions.
But perhaps the most surprising thing about Omaha is that this is the quiet part of the year, despite a list of activities sufficient to satisfy any population. Trust me, this list barely scratches the surface of the annual activities and events!
Sources
- Wikipedia‘s page on Omaha
- 15 of Nebraska’s Best Winter Activities by Katie Griffing for Best Things Nebraska;
- 10 things to do in Omaha during winter by Tim Trudell for The Walking Tourists;
- Omaha Winter Festival from the Figure Skating Club of Omaha;
- Winter Wonderland at Sycamore Farms;
- Omaha Annual Events from VisitOmaha.com
- Annual Events in Omaha by Omaha.net;
- 59 festivals in the Omaha area to check out this year curated by Kate Malott for Omaha.com;
- Annual Events & Festivals – Omaha, Nebraska from City-Data.com (a page that could have been really useful if they had provided dates for the annual events and festivals);
- Omaha Winter Fun Guide from FamilyFuninOmaha.com (a portal page to a lot of information. NB, right-clicking is disabled on the site).
With the Day 9 update, this part of the series is considered complete. Tomorrow, I start work on Part 4! “But wait,” you may say, “what about the promised entries for Las Vegas, San Francisco, and Honolulu? I was looking forward to those – I wanted to see how closely Honolulu’s weather resembled that of Puerto Rico!” For the answer to those questions, see the Day 9 update below.

Discover more from Campaign Mastery
Subscribe to get the latest posts sent to your email.


February 8th, 2018 at 1:11 am
Day 2 update: I spent Day 1 generating the montage (you might not notice it unless you track down the original images, but there was quite a lot of editing and tweaking involved), so this is the first day that I’ve actually had content ready to post here: Winter in Washington, DC!
Mike Bourke recently posted..The Inevitability of Extraordinary Characters
February 8th, 2018 at 11:48 pm
Day 3 update: Now with 100% more added Detroit! And thereby hangs the tale of today’s work on the article. You see, I started compiling images for the Chicago montage, but – somehow – had a brain meltdown and searched everywhere for “Detroit” instead. Only when I had finished compiling the list of images did the discrepancy between the two intrude upon my awareness. So I deleted them all and started over. And then thought twice about it. Chicago and Detroit are practically neighbors, so comparing and contrasting the two should be very interesting and useful. So I restored the images, and the list of same (making sure the two didn’t get mixed together). But that left only time to spellcheck the Washington entry. Three steps forward, and two back – some days are like that!
Mike Bourke recently posted..The Inevitability of Extraordinary Characters
February 10th, 2018 at 4:12 am
Day 4 update: Made up for lost time by completing the entry for “Winter In Detroit”, Montage and all. Tuesday: Chicago!
Mike Bourke recently posted..The Diversity Of Seasons Pt 3: Winter (cont)
February 13th, 2018 at 8:38 pm
Day 5 update: “Winter In Chicago” now half-way done. Covered the events of The Great Fire, the origins of the city, the modern-day metropolis, and started on the weather. Tomorrow, I’ll do the “crime wave” of the 20s and 30s, finish the winter section, and compile the usual list of winter activities. Thursday I should be able to do both the Chicago and Omaha Montages, leaving me free to write about the latter on Friday. At least, that’s the plan.
Mike Bourke recently posted..Superficialities or Convergent Evolution? By Raul Miranda with Mike Bourke
February 16th, 2018 at 12:52 am
Day 6: It was so hot in Sydney that even though I had finished writing the text needed to complete “Winter In Chicago” on schedule I didn’t trust myself to actually edit and publish it, I was so drained by the time it was done. So you get a double-update today.
Day 7: Completed “Winter In Chicago”, and created and uploaded the Montage that accompanies that section. Tomorrow, Omaha, Nebraska (I don’t think this winter narrative is going to heat up for a while yet)!
Mike Bourke recently posted..Superficialities or Convergent Evolution? By Raul Miranda with Mike Bourke
February 17th, 2018 at 12:39 am
Day 8 Update: “Winter In Omaha” 80% done. Tossing up whether or not to add 1-2 Rocky Mountain locations; the problem is that there are relatively few large/major cities in that mountain chain. Why 1-2? Because I don’t know if I need one on the eastern side, one on the western side, or both. Current thinking is Denver, Colorado and either Spokane, Washington, or Boise, Idaho. No decisions yet, and it might be that I need to conduct some level of research before I can make any. But if I do drop in any such, internal logic says they should be the next sections to come, so this has a fairly high priority.
Mike Bourke recently posted..Superficialities or Convergent Evolution? By Raul Miranda with Mike Bourke
February 21st, 2018 at 12:39 am
Day 9 Update: First the obvious: “Winter In Omaha” is done, montage and all, and the way the montage credits are presented has been revised for the entire article. If and When time permits, I’ll go back and organize those of the other articles to match.
The results of my research were very interesting, and have resulted in the addition of 4 new locations to the current tracking westward across the US because they all had interesting stories to tell.
To make room for them, and because this post is already over 15000 words long, and because this is Day 9 of working on it, I’m closing it out, having reached the middle of the US in this part, and having shown that longitude is a very important factor in determining the weather – not as an absolute, but relative to large bodies of water and the prevailing winds.
It’s been a productive day!
Mike Bourke recently posted..IQ and Intelligence in RPGs