The Diversity Of Seasons Pt 1: Winter
- The Diversity Of Seasons Pt 1: Winter
- The Diversity Of Seasons Pt 2 – Winter (cont)
- The Diversity Of Seasons Pt 3: Winter (cont)
- The Diversity of Seasons, Pt 4: Winter (cont)

I’ll be honest about this. I originally put Winter first on my agenda for this series because I thought that it would resonate with the majority of my readers, who live in the Northern Hemisphere. That was before the incredibly brutal conditions descended upon them, however. When that happened, I contemplated starting with Summer, instead, but I decided that would be too much like teasing. No, like winter itself, I ultimately decided, it was better to simply get this season out of the way.
It was unseasonably cold this morning, and that got me to thinking about how different places experience the same season in completely different ways. I realized that while there were descriptions available of the climate in this place or that, I had never seen a comparative climate codex.
Such a reference work is beyond the scope of a blog, but – in a smaller and more literate way – I thought I could hit a few high points along the way, and that the results would be useful to to GMs looking to model a regional climate in their games rather than resorting to stock cliches, or who were running a more modern-day campaign where the PCs did a lot of traveling from place to place.
Because of the amount of research involved, this type of article is perfectly suited to the Serial Blog approach. Four or five locations a week for four or five weeks, and so on. Except that I’m going to get the ball rolling with a big jump-start, right now.

These images, sourced from Wikipedia Commons, are used under CC3.0 and incorporate a photograph of McMurdo Station taken from Observation Hill by Gaelen Marsden.
1. Winter In McMurdo
McMurdo Station is a research center in the Antarctic, on the shore of McMurdo Sound, which is the southernmost navigable body of water in the world. Today, it is Antarctica’s largest community and a functional, modern-day science station, which includes a harbor, three airfields (two seasonal), a heliport, and more than 100 buildings.
The pack ice that girdles the shoreline presents a formidable obstacle to surface ships. Vessels require ice-strengthened hulls and often have to rely upon escort by icebreakers. During winter, resupply is all but impossible, though occasional air flights in and out are possible.
The Cold circumpolar currents of the Southern Ocean reduce the flow of warm South Pacific or South Atlantic waters reaching McMurdo Sound and other Antarctic coastal waters.
Bitter katabatic winds (winds that carry higher density air, i.e. colder air, down a slope at up to hurricane speeds) spilling down from the Antarctic polar plateau into McMurdo Sound demonstrate Antarctica’s status as the coldest and windiest continent in the world; The McMurdo Sound freezes over with sea ice about 3 meters (9.8 ft) thick during the winter. Temperatures during the dark winter months at McMurdo Station have dropped as low as -51 °C (-60 °F), but the station is actually sheltered from the worst of the winds by the Transantarctic Mountains, so it’s rare for the temperature to drop below -40°C (which is also -40°F).
McMurdo really only has two seasons – Summer and Winter. The intermediate seasons last a month at most. Winter runs from March to September. There is increasing precipitation from 15 to 28 cm (0.59 to 1.1 inches) from March to June, with the proportion of snowfall also increasing – 11.4 to 17.8 cm (4.49-7.01 inches) over this span. Note however that March is preceded by the heaviest average snowfall of the year, 22.4 cm (8.82 inches) in February. Extreme Conditions recede even faster than they built up; the July average precipitation is already less than that of April, while August is lower than March, and September lower still.
Particularly noteworthy are the number of wet days and the number of rainy days during this period. The averages run from a low of 3.2 to a high of 5.7 (unsurprisingly, in June). Snowy days are more common: from 17.8 (the annual high) to 13.3 in September.
Putting all this together, and you get a situation in which more than 2/3 of the time, Winter in McMurdo means either sleet or snow. Temperatures have to be considered extreme; I found this article at The Atlantic to be especially interesting, though it doesn’t go into too many details about the practices necessary in order to survive the conditions. For that, turn to this page at Cool Antarctica which is comprehensive.
There are proposals to reconstruct the base using demountable universal modules that can be re-purposed as needed – this month, quarters for research staff, next month an enlarged gymnasium and dining area, and so on.
It’s worth observing that diesel engines and generators don’t work as well at extremely cold temperatures – the colder it is, the more unreliable they become. For that reason, from March 1962 to 1972, power was supplied by a nuclear reactor with a core the size of an oil drum. The decommissioning was the result of hairline cracks and water leaks that posed an ongoing safety risk. The cause of these problems does not appear to have been conclusively established, but it is reasonable to point the finger at climatic conditions and temperature differentials. These days, power comes – despite the difficulties described earlier – from a number of 500 kilowatt (670 hp) conventional diesel generators in a central powerhouse used to generate power – with maintaining minimum operating temperature within the powerhouse likely to have first call on the power supply.
You get a very good idea of the conditions and isolation involved from John Carpentier’s film, “The Thing”. But for the real thing, look for Werner Herzog’s 2007 documentary, Encounters at the End of the World and Anthony Powell’s 2013 documentary, Antarctica: A Year On Ice.

These images, sourced from Wikipedia Commons, are used under CC3.0 and incorporate a photograph of one of Hobart’s most recognizable landmarks, the Tasman Bridge, taken by Stephen Edmonds.
2. Winter In Hobart
Hobart is the most southerly state capital in Australia, dominating the island state of Tasmania. It is also the second-oldest capital city and second least-populated Australian Capital with only 225,000 residents. When Australia was a penal colony, Tasmania was the dumping ground for the serious offenders, in part because the severity of conditions made escape and return to the mainland a very difficult proposition (nevertheless, it did happen – once).
The city faces the Tasman Sea that separates Australia from New Zealand, and is located on an estuary of the Derwent River; its harbor us the second-deepest natural port in the world.
In many ways, Hobart’s weather is, at first glance (like that of the other Capitals), quintessentially Australian. The highest temperature recorded there is 41.8°C (107.2°F) on 4 Jan 2013, and the lowest was -2.8°C (27°F), which it achieved twice – once in June 1972 and once in July 1981. It’s an impression that doesn’t stand up to closer scrutiny.
Hobart averages less sunshine than any other Australian capital; a mere 5.9 hours per day on average. However, during the summer, it has more hours of daylight than anywhere else, achieving 15.2 hours on the summer solstice. Of course, the term ‘daylight’ can’t be taken too literally; the skies are frequently clouded over, the city has only 40.8 clear days a year, on average.
It rarely snows in Hobart – it’s happens on average once every 15 years – but the adjacent Mount Wellington is often seen with a snow-cap, and mountain snow has been known to occur in all four seasons.
Winds are very important to the perceived temperature of the residents; when it blows from the northwest, the air is chilled by the snow-cap, and when it blows from the south, frigid antarctic air descends upon the city. The winds over Mount Wellington have been recorded at sustained speeds of over 157 km/h (98 mph), with rare gusts of up to 200 km/h (120 mph).
If it weren’t for those icy winds, Hobart would be an extremely desirable place to live. It lacks the extremes that characterize Australian weather in general, so much so that most Australians think there has been error made when they examine the average high and low temperature records, which – while quite cool – are astonishingly consistent. As a result, it’s actually fairly difficult to draw a line and say that one season starts here and ends there; the differences are quite small. The April average is 17.8°C (64°F); the May average is 15.1°C (59.2°F), and the June is 12.4°C (54.3).
The official Winter Months are June, July, and August, and they do have a consistently lower average temperature, however marginal the difference. But it’s probably more accurate in terms of the experience of visiting the city to suggest that Winter starts in May and runs through to September; these are the only months that don’t have a record high temperature above 30°C (86°F).
It’s the minimums that more revealing. Through the summer months, these average 12°C; in April, they drop a couple of degrees C to 9.4°C, in May, another couple more to 7.6°C, and in Winter, they hover around the 5-5.5°C mark. Warmth returns more slowly than it departed, in part because the second half of the year is wet more often than the first; September and October are the wettest months of the year, on average, though more precipitation actually falls in August than in either of those months.
It’s these factors – rainfall and minimum temperatures – that define the four seasons of Hobart. Winter is when the Antarctic Winds blow, punctuated by the occasional heavy rain event. But at any time of year, the climate is capable of delivering “four seasons in one day”.
Most bars and restaurants maintain an open fire during the winter months; if you would like Winter if it weren’t for the snow, Hobart is likely to be to your liking. The terrain tends to be too rocky for snow-related sports, but outdoors sports are popular in the summer months; expect the average fitness level of the inhabitants to be just a little higher than normal for a Western city.

These images, sourced from Wikipedia Commons, are used under CC3.0 and incorporate a photograph of the Melbourne Skyline by Jes.
3. Winter In Melbourne
Melbourne is almost as far south as Hobart, but the small difference has profound effects on the climate. The city – sometimes the largest in Australia, sometimes ceding that honorific to Sydney – is located in the south-facing large natural bay of Port Philip and expands into two separate mountain ranges, down one peninsula, and into a large valley, totaling almost 10,000 square kilometers. The primary water-source is the Yarra River.
Melbourne is the city that “four seasons in one day” is supposed to describe. It’s said that if you don’t like the weather there, just wait an hour or two. The cause is the location; the city is built at the boundary between the very hot inland area and cool southern ocean, but the resulting atmospheric turbulence is at a minimum in Winter; this is the most stable and predictable time of year, weather-wise – damp and often cloudy.
Port Phillip Bay is often warmer than the surrounding oceans and/or the land mass, though this effect is also minimized in winter; this can set up a “bay effect” similar to the “lake effect” seen in colder climates where showers are intensified leeward of the bay. Relatively narrow streams of heavy showers can often affect the same places (usually the eastern suburbs) for an extended period, while the rest of Melbourne and surrounds stays dry. Overall, Melbourne is, owing to the rain shadow of the Otway Ranges, nonetheless drier than average for the southern part of the state of Victoria in general. That means that the eastern suburbs are drier in winter than in other seasons, while those to the north and west are wetter than in other seasons – while both get about the same total rainfall and count of rainy days over the course of the season.
Remembering that the bulk of the city is essentially at Sea Level, snow has not been recorded in the Central Business District since 1986, though it is occasionally seen at higher elevations in the outskirts. Frosts and Fogs are routine occurrences at this time of year, however.
Melbourne’s Winter is marked with a clear beginning, middle, and end, and runs from June to August. The Average number of rainy days increases from the start of winter and stays high throughout most of Spring. The Average high and low temperatures are almost-perfectly symmetrical about mid-winter; between 11.4°C and 11.8°C (52.5-53.2°F) high and just under 8°C (46°F) overnight, respectively, in June and August, falling to 10.7°C (high) and 7.1°C (low) (51.3-44.8°F) in the coldest part of the daily cycle.
It’s also not uncommon for Winter to start or end a couple of weeks late, producing unseasonable warmth in late May or unseasonable cold in early September; this phenomenon is most clearly reflected in the record minimum temperatures for the city. The value for May is almost as cold as that of June, which is virtually identical to the value for August; September’s record minimum is noticeably higher. (-1.1°, -2.2°, -2.8°, -2.1°, -0.5°C, (30°, 28°, 27°, 28.2°, 31.1°F) respectively). Once again, though, “Winter” is clearly discernible in the middle of that series.
This Wikipedia Article lists every recorded extreme weather event in Melbourne’s history, and a very long list it is, too. The list is rather more abbreviated when only Winter events are considered:
- 1 August 1849 – A snowstorm blankets Melbourne for the first and last time in history (with accumulation on the streets).
- 26 July 1882 – Snow falls for half an hour in Melbourne.
- 1951 – A moderate cover of snow blankets the central business district (CBD) and suburbs.
- 31 May 2013 – Melbourne faces heavy rain and thunderstorms; Melbourne Airport records 10mm of rain in 10 minutes just after 9 PM
- 18 July 2013 – Melbourne records the highest July temperature ever, reaching 23.3 °C (73.9 °F).
Lest this list leave readers with the wrong impression, let me hasten to add that 2015 was the coldest winter in 26 years, and just last winter it was described as “Australia’s most livable Ice Palace” – refer 32 thoughts everyone has during a Melbourne winter. However, this is a VERY Australia-centric list in it’s language; many of the entries will need explanation for non-Aussies, such as “5. Does Milo really give you cancer?”. Enough should survive, however, to give a sense of the place.
Readers might also find the general Wikipedia article on the city to be of value; you’ll find that much of the raw information given has been cribbed from it.
The locals respond to the greater consistency of climate with enthusiasm; in many respects this is the height of the social season. You can get a sense of the place at this time of year from this site, which has collated a number of articles on the subject, and from this travel guide devoted to this subject in particular.
There is one other subject that needs to be mentioned before I wrap up this section: Winter is the height of the annual AFL (Australian Football League) season, and Melbourne is the capital of this contest. Loyalties are tribal, almost cult-like, and generally last for life, if not crossing over generational lines. When a Melbournian migrates to another residence within the city, there’s at least a 50-50 chance that his team loyalties will remain unchanged, and if one were to offer an anecdote about a divorce being granted on the grounds of incompatible AFL teams, at least half of Australia would believe it – and half of those remaining would be uncertain. While this contest has been slowly branching out into other states over the last 25 years or so, this is the heartland.
You can’t really talk about Winter in Melbourne without talking about the AFL, though it’s a little beyond the scope of this article; so I’ll simply refer readers who want to know more to a number of other sources:
- Wikipedia’s Article on the sport itself;
- Wikipedia’s Article on the annual contest; and
- The AFL’s Official Website.
And, if you have to pick one of them to barrack for from afar, my Pulp co-GM would insist on my recommending the West Coast Eagles!
More to the point, some observers will swear that each club has it’s own core philosophy and style, and that it attracts supporters who hold a similar ethos in their hearts. How true that may be, I have no idea; I’ve heard the same thought voiced with respect to Americans and their AFL (a completely different game), and to Americans and their Baseball teams, so take it with a grain of salt and season with your own experiences. If the observation is even partially-valid, this is the time of year when it will be at its most extreme and influential, save when teams make the final eight or (better yet) the Grand Final!

These images, sourced from Wikipedia Commons, are used under CC3.0 and incorporate a photograph of the Sydney skyline taken from the north by Adrian Gigante. To the right is the Sydney Harbour Bridge and to the extreme left, the Sydney Opera House.
4. Winter In Sydney
I’ve lived in Sydney for most of the last 37 years, and for much of it, I’ve been located in one of four adjacent suburbs. The astonishing thing that I have learned in that time is not how similar the weather is between these locations, but how different it can be. Wiley Park’s weather is very much like that of nearby Bankstown; Lakemba, adjacent to Wiley Park, is similar, but a little warmer and wetter; Belmore; adjacent to Lakemba, is cooler and drier (most of the time), and it’s weather varies just a little in every possible parameter from that of it’s neighbors, to the point where a rival forecasting service is more accurate than the one that used to be dead-on when I lived in Lakemba.
Most of Southern Sydney’s cloud-oriented weather comes from the South or the south-west. These suburbs are not very wide; Wiley Park is roughly rectangular, and the long side (about 3:2 ratio) inclined about 30° to the West, so the leading edge of the suburb is about 1 km wide. Lakemba is slightly narrower and longer, with a leading edge of roughly 0.75km. Belmore is much longer, and with a corner removed from the top right of the rectangle; the eastern boundary is also a far more irregular in shape, so this is very much an approximation. Nevertheless, the leading edge is also about 0.75km. I didn’t live on the extreme edges of the suburbs, my location was far more central than that. So I’ve moved a distance (as the crow flies) of about 1.65km and experienced three different forecasts as accurate.
Wet Weather in the southwestern suburbs, in other words, seems to flow down “channels” toward the Hawkesbury River, which bisects, the city east-west, and then flows east toward the CBD and the harbor, which has a quite different forecast again. Farther west, the Blue Mountains are a more dominant influence and the weather comes in more South-westerly or Westerly. North of the Hawkesbury, and the weather source is as likely to be the West as it is the South, but it bends southward in it’s course. In the Eastern Suburbs, beyond the CBD, there is a natural “bowl” centered on the suburb of Randwick, where – it is said – if it rains anywhere in Sydney, it will also rain.
Rain, however, sweeps in from the clouds in bands from the North-east, bands which slip steadily toward the river. As a result, it can be raining in one of those suburbs and bone-dry in it’s neighbors. Part of the reason for all this is local topology, and part is the influence of man-made structures, but that’s more of a summer phenomenon, so I’ll defer discussion of it until part 3 of this series.
In the CBD, it’s quite common for early-morning clouds to roll in from the sea; many a time I have been fooled into dressing for colder, wetter weather only to have the cloud burn off by ten or eleven AM to reveal the blazing hot Australian sun. This effect is even more pronounced in Winter than it is in Summer, though daylight savings exaggerates what effect there is. The CBD, Eastern, and Northern Suburbs are also subject to the occasional coastal storm or wind condition that does not affect the rest of the city, or are substantially diminished.
Winter days in Sydney tend to be characterized either as quite mild and comfortable, or dominated by frigid winds blowing over the mountains. It is not uncommon for cool changes to drop the temperature by 20°C (36°F) or more in the span of minutes. Warmth returns more slowly.
Another substantial contributor to this effect is the size of Sydney. More than 12,000 square km (almost 4800 square miles), and with a population density of 1000 people for each of those square miles. The westernmost suburb is Emu Heights, 60km west of the CBD, with the Easternmost suburb along the same line located 8km further out. Dividing 12000 by 68 gives almost 175, showing that Sydney is more than twice the length north-south as it is east-west, and the average coastline runs slightly east of north. The shape is an indicator of the influence of the blue mountains, which parallel the coastline.
Of course, what we call “Mountains” are not what most Europeans or North Americans would recognize by the name. That’s because they are so old that all the surface soil has eroded and blown away, leaving only the “bones” of the mountains. This played a key role in Australian settlement, as it took a LONG time for a passage to be found across the Blue Mountains. This was because the explorers attempted to follow the valleys and low passes; this works with younger Mountains because softer earth tends to accumulate in the lee of one or both mountains, filling in the cracks and rocks. In the Blue Mountains, that ‘padding’ is long-gone, exposing the rocks; I was about five years of age when I first beheld the Three Sisters, a famous rock formation near Sydney that illustrates the point.
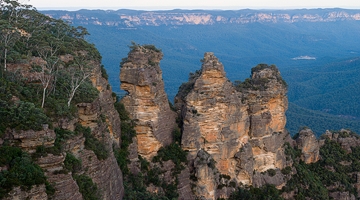
Click this link to view licensing information and gain access to a glorious 3200×1780 version of the image. The lighter-colored areas are freshly-exposed rock, subject to erosion.
In the short term, weather seems to follow a weekly pattern – if it rained on Tuesday last week, it’s more likely to rain somewhere in between Monday Night and Wednesday Morning this week. Every now and then a more substantial weather change comes along and adjusts this pattern, usually by a day one way or the other, setting a new weekly pattern in motion. This pattern-effect holds true for daily maximums, nightly minimums, wind strengths, and perceived temperatures, as well as rainfall amounts, durations, and start times. In the finer detail, of course, each day and each week is different, but the general impression remains. This is most true in Summer, somewhat less true in Winter and Autumn, and has lowest reliability in early and mid-Spring. As a forecasting principle, it has a 70-80% accuracy – at least in terms of detailed generalities.
Officially, the city has a subtropical climate, which (amongst other things) means that it experiences rainfall distributed equally throughout the year. In reality, things are not quite so simple. Winter is actually the driest season of the year, with rain tending to occur in heavier falls during the season, but more dry days. It’s fairly rare for cloud to persist more than 24 hours without rainfall, however. At Sydney’s official primary weather station (Observatory Hill), extreme temperatures have ranged from 45.8 °C (114.4 °F) on 18 January 2013 to 2.1 °C (35.8 °F) on 22 June 1932. An average of 14.9 days a year have temperatures at or above 30 °C (86 °F) in the CBD.] In contrast, the metropolitan area averages between 35 and 65 days, depending on the suburb.
Due to the inland location, frost is recorded in Western Sydney a few times in winter (it used to be regularly). From 1990-1999, Sydney received around 20 thunderstorms per year, and these are regularly severe; one such storm was the 1999 hailstorm, which produced massive hailstones up to 9 cm (3.5 in) in diameter. In late autumn and winter, east coast lows may bring large amounts of rainfall, especially in the CBD. Snowfall was last reported in the Sydney City area in 1836, while a fall of graupel (soft hail) that was mistaken by many for snow in July 2008, has raised the possibility that the 1836 event was not snow, either. That said, this is the wrong time of year for hail events in Sydney.
The weather in the last 15 years or so has been markedly different to that which I experienced prior to that date. Seasons seem to start 2-4 weeks after their allotted date, and both Summers and Winters have been milder on the average (I can remember 40+°C days occurring in late September / early October. This year, it was late November). This effect has started to distort the temperature records, and is something that needs to be taken into account when assessing those records.
Sydney’s Weather is somewhat more complex than a simple four-season model. Based on average temperatures, Winter runs from June to September. June and July are true winter months, with Average Lows of 9.8°C (49.6°F) and 8.7°C, respectively, but the May averages are more akin to those of Autumn while September is more akin to Winter than Spring. Basically, the weather stays cold until a week or slightly less of strong (even gale-force) winds batters the city, often accompanied by rain and one final plunge in temperatures; a week or two of pleasantly mild conditions (warm with cool breezes) follows, and then temperatures begin to soar.
The average number of rainy days in June and July is 10.5 and 10.2, respectively, plummeting to 8.4 and 8.8 in August and September.
It’s also worth noting, when you go looking for official sources, that the “City” of (Greater) Sydney (usually just called “Sydney” by residents, and nicknamed “The City”, or “The Big Smoke” by non-urban locals) actually comprises a number of smaller “cities”. These are political divisions more than anything else, a limit to the reach of local governments. You observe the same pattern in Los Angeles, where I remember the “City” of Anaheim being something completely separate from the “City” of Los Angeles. As usual, such confusion results from one word being used for two separate jobs.
While Sydney now has two AFL teams (refer “Winter In Melbourne”, above), Rugby League is the dominant winter passion here. Fans are, however, just as tribal, and just as passionate as their southern cousins (see also the section on Brisbane to follow). Soccer is also gaining in popularity. Nevertheless, winter in Sydney is relatively short of season-specific activities, at least in comparison with our Southern neighbors. One notable exception is that this is the season of local street festivals. Another highlight is Vivid Sydney, when various buildings are “painted” using colored lights. It’s notable that number two on this list of 50 Things To Do In Sydney In Winter Under $50 takes you beyond Sydney’s borders, and that most Sydney-siders wouldn’t be caught dead at Number 11, Number 25, Number 26, or at several of the other listed “things to do”. For most, Winter is a time to stay at home close to a heat source, as much possible.
This list of 20 Things to Do In Sydney This Winter For Under $20 (from a completely different site) is probably more responsive in terms of activities the majority might participate in, at least until you get down toward the end of the list. (The prices appear to be in Australian Dollars, multiply by about 7/10 to get USD, or halve it for Euros/Pounds). We’re not an especially art-and-culture -oriented city. As a general rule, you’re more likely to go visit a friend and watch the “footy” together than you are any more organized activity.
It’s also noteworthy that Winter is when all the US “Summer Blockbusters” hit cinema screens. Although cinemas have declined in popularity (due to high prices and the rise of home equivalents), this remains the peak season.
More commonly, though, people drive out of the city to go skiing in the snowfields, hiking in the bush, or simply exploring the state. This is somewhat true in summer (when there is no snow) but is especially true in Winter. Every Friday during the season, there is an exodus sometimes estimated at between 5 and 10% of the population (I think those claims exaggerated, personally). Winter’s also a good time to hop in the car and visit relatives.
The final thing that you need to understand about Sydney In Winter is the diversity of the population. Sydney became one of the most multicultural cities in the world after mass migrations following the second World War. According to the 2011 census, more than 250 different languages were spoken in Sydney and about 40 percent of residents spoke a language other than English at home. Furthermore, 36 percent of the population reported having been born overseas. My own suburb is home to 136 Ancestries, making it one of the most diverse in the city, right down to 3 Fins and 3 Danes who were living here at the time of the last census.
More to the point, Sydney (and Metropolitan Australia in general) is one of the world’s great melting pots, especially when it comes to cuisine. No culture that comes here fails to rub a little of itself off onto the broader community, and to have a little of that broader community rub off onto it. Pizza in Australia – especially at the lower-budget end – is nothing like the Italian dish from which it is sourced, nor is it quite the same as what an American would expect. Chinese food is also just a little different to that which you will get anywhere else. And if there’s a fusion to be tried, an Australian is probably trying it. I don’t think you would be able to buy rattlesnake or moose meat here, because the species are not indigenous to the country; anything more common can probably be sourced! My next grocery order contains Apple and Cider Pork Sausages, French Deserts (instant from the fridge), and Low-fat Greek Yogurt (with Fruit) – to name just three items!
Each ethnic group reacts just a little differently to the change of seasons, whether it be in terms of what they eat, drink, or do, socially. A wintry social life in Sydney is defined by who you know, not what you know!

These images, sourced from Wikipedia Commons, are used under CC3.0 and incorporate a photograph of Brisbane by Lachlan Fearnley.
5. Winter In Brisbane
Brisbane is right next to Sydney on most maps. That’s because the world is such a big place; in fact, the two CBDs are about 915km (570 miles) apart, and that’s more than 2% of the circumference of the planet, so it shouldn’t be surprising that the weather forecasts between the two bears very little resemblance to each other, even though technically, they are both considered “subtropical”.
Brisbanites like to make a big deal out of their winters. The Urban List, based in Brisbane, writes, “Being from Brisbane, we don’t realize how much of a non-event our winter is. There’s always a certain few who insist on donning scarves, gloves, beanies and a jacket when the mercury hits 21. But sorry Brisbanites, our winters just ain’t that bad” in introducing their article, ‘50 Truths about Brisbane’s Winter‘. Because their list conveys a sense of the season and the reactions to it very effectively, let me quote a few of the entries:
- 1. We get excited about actually being able to sleep with a sheet covering us.
- 4. You buy a coat because winter is coming, but it only gets worn once, and even then you probs [probably] could have opted for a cardie [cardigan].
- 17. Your morning greeting is replaced with ‘OMG it’s SOOO cold today!?’
- 25. You hear the daily ‘you guys have nothing to complain about with your winter!’ and shake your head in disbelief; ‘it’s cold’, you argue, ‘it’s cold!’
- 28. Your pride is hurt when you see that the weather in Tasmania is minus 50 [°C, -56°F, an exaggeration], with snow.
- 29. But, you “know” that even though we’re still in double digits, our winter is just as cold as there anyway, when you factor in wind chill…
So, what’s the reality?
Winter in Brisbane is normally blue skies and warm weather. Mean temperatures are between 11 and 21°C (51.8 and 69.8°F, respectively). Early mornings and nights can be crisp, but overnight lows rarely drop below 9°C (48.2°F). It never snows there, though light falls have been reported elsewhere in Southern Queensland at altitudes, i.e. in the Granite Belt, most notably in Stanthorpe, which although 300 km (186 miles) Southwest, sometimes somehow becomes magically conflated with the city in conversations with locals related to winter weather – usually in the form of the local responding to a comment about the mildness of the (typical) weather by mentioning “It did once snow at Stanthorpe” as though that town of 4800 or so were a suburb of the city.
It’s my opinion that the psychological impact of weather that doesn’t threaten to melt the pavement underfoot at any moment is greater than any actual discomfort due to the weather – or, to put it another way, the residents become so acclimatized to baking hot temperatures through the rest of the year that winter is highlighted through sheer contrast. Brisbane is located North (i.e. closer to the equator) than the famous Gold Coast, which provides another clue as to its weather.
The city is centered along the Brisbane River, and its eastern suburbs line the shores of Moreton Bay, which is a downward-pointing teardrop shape, with a number of islands including North Stradbroke Island and Moreton Island forming the eastern “outline” of the bay. The bay is open to the north, and has a few smaller openings to the East, but is sheltered in every other direction. The greater Brisbane region is on the coastal plain east of the Great Dividing Range, with a metropolitan area that sprawls along the Bay floodplain from Caboolture in the north to Beenleigh in the south, and across to Ipswich in the south west.
A lot of the city is hilly; the urban area, including the CBD, are partially elevated by spurs of the Herbert Taylor Range, such as the summit of Mount Coottha, reaching up to 300 meters (980 ft) and the smaller Enoggera Hill. As is often the case, small differences in altitude can mean the difference between catching a breeze or not; in summer in particular, this can make a big difference to the perceived weather, but there is some effect even in winter.
Due to its proximity to the Coral Sea and a warm ocean current, Brisbane’s overall temperature variability is somewhat less than most other Australian capitals, particularly in winter, when maximum temperatures below 20 °C (68 °F) are relatively uncommon. On 19 July 2007, Brisbane’s temperature fell below the freezing point for the first time since records began, registering -0.1 °C (31.8 °F) at the airport station. The city station has never dropped below 2 °C (36 °F). Locations directly west of Brisbane such as Ipswich have dropped as low as -5 °C (23 °F) with heavy ground frost. The average July day is around 22 °C (72 °F) with sunny skies and low humidity, occasionally as high as 27 °C (81 °F), whilst maximum temperatures below 18 °C (64 °F) are usually associated with brief but not uncommon periods of cloud and winter rain. On the penultimate day of winter in 1943, the Brisbane Regional Office station recorded a temperature of 38.3 °C (100.9 °F).
Examining the weather records more closely, it is possible to clearly distinguish two entirely separate winters. If you were to base your climate model on average maximums, you would point to June and July as being the only true winter months; those are the months when the record stands below 30°C and the average high is below 22°C (71.4°F). If you look at minimum temperatures, then there are clear transitions in April-May and September-October, identifying Winter as the period of three months in between (June, July, and August). The average lows in those three months are 11.8°C, 10.2°C, and 10.8°C, (53.2, 50.4, and 51.4°F) respectively, so the early period of winter is slightly warmer than the end. Record Minimums blur this picture slightly; the May record low is identical to that of June (both 5°C 41°F), while July and August have record minimums of 2.6°C and 4.1°C (36.7°F and 44.6°F) respectively.
This paints a picture of a season that creeps up on the city in isolated cold snaps, which gradually even out as the peak warmth of the day diminishes.
For anyone looking to roleplay a visit to the city, one tip: The older architecture is slightly different to that of the rest of the country. Pre-1950, housing was often built in a distinctive style now known as a Queenslander (You know your state’s architecture is unique when it’s named after the state itself!) This features timber construction, large verandas, high ceilings. Many of these houses are elevated on stumps (also called “stilts”), that were originally timber, but are now frequently replaced by steel or concrete; this permits cooler air to circulate beneath the house, assisting in keeping it cool. Queenslander houses are considered iconic to Brisbane and are typically sold at a significant premium to equivalent modern houses. I’ve included a link to the relevant Wikipedia page; residents of the US Southern states will find a lot that looks familiar to them, architecturally.
As usual, let me now turn to the activities that characterize a Brisbane Winter (it’s trite but true to some extent to say, think of what most places do during the spring/summer). The tourist information page ‘30 things to do this winter in Brisbane‘ introduces itself in a manner that should now be familiar: “The closest Brisbane gets to freezing point is the ice in our drinks – so raise ’em high and celebrate crisp, clear days of winter sunshine, our all-seasons event line-up and the joys of wearing a jacket for those three weeks it is possible. In the depths of winter, Brisbane’s overnight temperature may dip below 10 degrees, so pack your walking shoes as being outdoors is always on the agenda.” The site then goes on to list 30 activities (as promised), all related to a winter that has now passed and which is not identified anywhere on the page that I could see – but, being an official site, it seems most likely to have been Winter 2017. Despite the information potentially being a little out of date, this makes a great starting point for research on the city in this time of year thanks to the external links buried throughout the article – and it has the bonus that, as an official site, it is likely to be refreshed annually.
Another great resource, especially when used in conjunction with the above, is the tourist-targeted article ‘Top 10 things to do in Brisbane this winter‘, which captures a bit more of the flavor of the city by looking at the activities in slightly greater depth. GMs may also find the general Wikipedia article about the city to be useful.
I want to explicitly call attention to #11 of the “30 things to do” (it doesn’t even make the “Top 10” list.
When it comes to Rugby League, Brisbane is just like a suburb of Sydney so far as fan tribalism goes. They have a franchise in the New South Wales competition that is treated with no more welcome, hostility, or disdain than any other team that is not your own. All that changes when one particular event rolls around – the one pictured in the “30 things” article: The State Of Origin series.
The idea is that the best players deriving from Queensland (regardless of their playing for different clubs the rest of the time) will get together for an annual three-game series against the best that New South Wales can gather. And, if the typical Australian’s support for his local team is tribal in its dedication, devotion, and intensity, the Blues (New South Wales) vs the Maroons (Queensland) is positively Primal in comparison. During my lifetime, Australia has been involved in three or four wars, and I’ve seen news and archival footage of our involvement in Korea and two World wars. The intensity of passion for all of them pales in comparison to the extremes that crawl out of the woodwork during those few weeks. It’s like the Superbowl in Australia, or the Grand Final for countries where Soccer is the predominant form of football – but it envelopes everyone who follows the code, not just two particular teams.
Supporters sprout team colors – sometimes appropriately for their position within society, sometimes not. Businesses sprout team colors and put on special discounts. Any possible link with the contest is celebrated, no matter how tenuous. During the game, local pubs and clubs are standing room only (or less). All other tourism activities take a remote second place; it’s akin to being the host city of a Summer Olympics (and I use the comparison advisedly), but without the infrastructure and inconvenience.
The three games are held in May, June, and July respectively. Any visitor to Brisbane, or to Sydney for that matter, in the weeks when a game in imminent, will not be able to avoid it. It also forms a shadowy backdrop to three-quarters of the team games in this period; any outstanding plays (good or bad) will automatically yield a discussion of the state of origin implications. This is a piece of local color that has to be incorporated into any post-1970 visit to either city.

6. Winter In Tahiti
Tahiti, Marvel’s Agents Of S.H.I.E.L.D. would be quick to remind you, is “a magical place”, virtually the archetypal representative of the Tropical Paradise. One of the first things you will discover when researching Tahiti through Wikipedia is that there is not a lot of information on the climate available. Either it is mind-numbingly consistent year after year after year, or you will have to dig a little deeper.
Tahiti is the largest island in the windward group of islands that forms part of French Polynesia in the Central Southern Pacific. There are 118 islands in total within French Polynesia, and they are strewn across four million square km of ocean, clustered into five archipelagos – the Society Islands, the Tuamotu Islands, the Gambier Islands, the Marquesas Islands and the Austral Islands. Tahiti is part of the Society Island archipelago.
I’ve been there once and remember only that it was bakingly hot even in the air-conditioned jet lounge, but not the furnace that crossing the concrete tarmac to reach it had been. French is the official language but the locals also speak Tahitian. Tahiti.Com lists a few common phrases in Tahitian, and can be a handy reference – hello, goodbye, welcome, and thank you.
In actual fact, Tahiti is two volcanic islands that are joined; the larger one lies to the northwest and is known as Tahiti Nui, and the smaller one connects to it and is known as Tahiti Iti. The capital of French Polynesia, Papeete, is on the Northwest coast of the larger island. Tahiti is 5700km from Australia (3078 nautical miles), 7900km (4266 nautical miles) from Chile, and 4400km (2376 nautical miles) south of Hawaii, with whom it shares a Time Zone.
The interior of Tahiti Nui is almost completely uninhabited. The southeastern part of Tahiti Iti can only be reached on foot or by boat, and so Tahiti Iti is largely isolated; the rest of Tahiti is encircled by a main road that cuts between the mountains and the sea, while a scenic interior road winds into higher altitudes past dairy farms and citrus groves.
Tahiti is genuinely tropical in climate, receiving almost continuous sunshine daily – the Tuamoto Islands of French Polynesia receive more than 3000 hours annually – and just enough rain to keep everything lush. The sun rises and sets at the equator at 6am and pm nearly every day; the tropic latitudes at their most extreme see a sunset at about 5:30pm, and sunrise can be as late as about 6:40AM.
The air temperature, which can vary from one archipelago to another (generally, the further south, the cooler), typically stays between 24°C and 30°C (75°F and 85°F), and the water temperature ranges from 22°C to 26°C (73°F to 79°F). In general, the high volcanic islands like Tahiti are more humid than the low coral atolls because the islands are dense with vegetation and the atolls are more exposed to trade winds. The lowest temperature ever recorded at Papeete is 16°C (61°F).
Winter in Tahiti lasts from April to October – some say March to November, others May or even June to October – and is one of only two seasons recognized. For these 7 months of the year, the temperatures are slightly cooler and the humidity reduced; this is considered the ‘dry’ season. July and August (especially the latter) are the coldest months, thanks to the trade wind known as maraamu. As usual, the differences between the different definitions depend on the basis by which the season is identified; Tahiti has 7 warmer months in the year, but 8 dryer months, and they don’t synchronize.
As usual, when you dig a little deeper, interesting details emerge. The number of days in winter which received precipitation, for example, varies from 17 in December to 7 in August and September. 17, of course, is more often than 1 day in 2, while 7 is closer to 1 day in 4 and may well indicate regular intervals of more than a week between rain showers. The average number of rainy days is even lower.
July and August are also the only months that don’t average a single day with a temperature high of better than 32°C (90°F); June and September typically contain 4 each, May and October 6, November 8, December 9, and the rest of the year 10 or more.
Tahiti is not the place to go if you are sensitive to high humidity. The low point of the year (on average) is 78% in October; the high is 82% in April and June.
I found the information at Weatherbase.com to be very helpful in compiling this entry. It is probably worth noting that many of these records have only been kept for the last 5 years, however, unlike other locations that have a century or more of data to draw upon.
May 1 to October 31 is also the peak tourist season, attracting higher prices and greater demand, though some resorts change their prices starting April 1. That advice, and plenty more local color, can be sourced from the Visual Itineraries .com page, ‘Best Time of Year to visit Tahiti‘, which I found to be an excellent resource.
Insects, sunburn, sunstroke, and dehydration are ever-present dangers in Tahiti regardless of the season. You are also likely to be troubled by mosquitoes and a small sand fly known as the no-no unless adequately protected. Less common are encounters with stonefish, which can survive for up to 24 hours out of the water, and which inject highly-lethal neurotoxins when stepped upon.
Winter is also the time of year when visibility for diving is at it’s best, so that quite obviously heads any list of winter activities. For more, check out the “best time of year” article linked to, above, but they include the obvious: hiking, swimming, surfing, and scuba diving. Tahiti is famous for it’s black sand beaches, the results of erosion of the volcanic rock that forms the island. Note that Summer is the best time of year for the local cuisine, however.

Incorporates a photo of the oldest street in Cairo, Muizz Street, officially listed as having the greatest concentration of Medieval architecture anywhere in the Islamic World, by Mohammed Moussa.
7. Winter In Cairo
(Much of the following three paragraphs is quoted directly, or derived, from the very informative Tour Egypt website, quoted because I could not express it any more clearly. There’s a lot more info on the page, I’ve only grabbed the introductory paragraphs!)
Throughout Egypt, days are commonly warm or hot, and nights are cool. Egypt has only two seasons: a mild winter from November to April and a hot summer from May to October. The only differences between the seasons are variations in daytime temperatures and changes in prevailing winds. In the coastal regions, temperatures range between an average minimum of 14°C in winter and an average maximum of 30°C in summer.
Temperatures vary widely in the inland desert areas, especially in summer, when they may range from 7°C at night to 43°C during the day. During winter, temperatures in the desert fluctuate less dramatically, but they can be as low as 0°C at night and as high as 18°C during the day.
The average annual temperature increases moving southward from the Delta to the Sudanese border, where temperatures are similar to those of the open deserts to the east and west. In the north, the cooler temperatures of Alexandria during the summer have made the city a popular resort. Throughout the Delta and the northern Nile Valley, there are occasional winter cold spells accompanied by light frost and even snow. At Aswan, in the south, June temperatures can be as low as 10°C at night and as high as 41°C during the day, when the sky is clear.
In the upper part of the middle of all of this is Cairo, by a substantial margin, the largest city in Egypt. 6.76 million inhabitants are concentrated into 453 square kilometers (175 square miles), and an additional 9.5 million people live in close proximity to the city. That’s a population density of close to 15000 people per square km, or – to put it another way – the average is 67 m from one person to another. This is about one and a half times the population density of New York City. Cairo has more than 82% of the population of NYC crammed into 58% of the area. This is a fact that many GMs often forget; privacy is that much harder to find, and crowds gather more quickly and spontaneously, which is why I’m making a point of it.
Cairo is located 165 kilometers (100 mi) south of the Mediterranean Sea and 120 kilometers (75 mi) west of the Gulf of Suez and Suez Canal, on the Nile River, immediately south of the point where the river leaves its desert-bound valley and branches into the low-lying Nile Delta region. Although the greater Cairo metropolis extends away from the Nile in all directions, the city of Cairo resides only on the east bank of the river and two islands within it. The Western bank of the Nile across from Cairo contains the city and protectorate of Giza (a relationship similar to that between New Jersey and New York City, if Jersey were the dominant cultural and tourism destination of the two).
Until the mid-19th century, when the river was tamed by dams, levees, and other controls, the Nile in the vicinity of Cairo was highly susceptible to changes in course and surface level. Over the years, the Nile gradually shifted westward to it’s present position. The land on which Cairo was established in 969 (present-day Islamic Cairo) was located underwater just over three hundred years earlier. Because of the Nile’s movement, the newer parts of the city – Garden City, Downtown Cairo, and Zamalek – are located closest to the riverbank. These areas are home to most of Cairo’s embassies, and are surrounded on the north, east, and south by the older parts of the city. Since the late 20th Century, the areas of most rapid growth have been to the North and extreme East of Cairo.
Cairo is located in what is officially a Hot Desert Climate, but is atypical of such climates because of the frequent high humidity. Wind storms can be frequent, bringing Saharan dust into the city, sometimes from March to May and the air often becomes uncomfortably dry. The winds responsible are known locally as khamaseen, but are also referred to in other locales as khamsin , chamsin or hamsin. The first of these three is the most common western usage of the word. The Khamsin is a dry, hot, sandy local wind from the south, anywhere in North Africa and the Arabian Peninsula. Similar winds in the area are sirocco and simoom. From the Arabic word for “fifty”, throughout the Levant, these dry, sand-filled windstorms often blow sporadically over a fifty-day period in Spring, hence the name. When the storm passes over an area, lasting for several hours, it carries great quantities of sand and dust from the deserts, with a speed up to 140 kilometers per hour, and the humidity in that area drops below 5%. Even in winter, temperatures can rise above 45°C (113°F) due to the storm winds. These sand storms are reported to have seriously impeded both Napoleon’s military campaigns in Egypt as well as Allied-German fighting in North Africa in World War II. (From the dedicated Wikipedia page on the subject). The most common occurrences are in April but occasionally occur in March and May. They can cause the temperature to rise 20°C or more in just two hours (36°F).
Egypt receives fewer than eighty millimeters of precipitation annually in most areas. Most rain falls along the coast, but even the wettest area, around Alexandria, receives only about 200 mm (7.9 inches) per year. Alexandria has relatively high humidity, but sea breezes help keep the moisture down to a comfortable level; the amount of precipitation decreases suddenly as one moves Southward. Cairo receives a little more than one centimeter (0.8 inches) of precipitation each year. The city reports humidity as high as 77% during the summer, but during the rest of the year, humidity is quite low. The areas south of Cairo receive only traces of rainfall; some will go years without rain and then experience sudden downpours, resulting in flash floods.
In October, night-time temperatures begin to decline markedly, signaling the transition to Winter. In November, both daily minimums and maximums decline, the record highs drop below 40°C (104°F), and the record minimums plunge to single digits centigrade (41.4°F or less) at night. These conditions persist with varying intensity throughout December, January, and February. In March, record maximums again break the 100°F mark, but the average high remains relatively mild at 23.5°C (74.3°F); in April, temperatures a two-month rise, signaling the end of the season. Without having lived there, I suspect that the record maximum has resulted from an early end to the season one year.
You get, perhaps, the clearest delineation between the seasons by studying the rainfall records. For the three hottest months, these are uniformly zero; October, 0.7mm; November 3.8mm; December, 5.9mm; January, 5mm; February and March, back down to 3.8mm; and, as temperatures rise, 1.1mm or less until Summer is once again reached.
In terms of activities, very few sites distinguish the seasons, but it can be convincingly argued that as the cooler temperatures would be more comfortable, winter would be the height of the tourist season, and therefore everything listed would be on the table. Two exceptions to this rule are
- The yTravel Insider’s Guide article What To Do In Egypt, which has specific advice relating to winter amongst a mountain of relevant and useful information. About 1/3 of the way down the page, you might get the impression that it ends; it doesn’t, just keep scrolling. I recommend this site to any GM planning an adventure in Egypt for the sheer depth of information;
- and, secondly, the Daily News Egypt travel article, The Best Winter Getaways In Egypt for the (rare) specifically-seasonal topicality.
More ‘normal’ traveler activity resource sites include (in declining number of entries)
- Trip Advisor‘s page, The Ten Best Things to do in Cairo which lists far more than ten entries and covers the entire Cairo Governate; it’s short on detail but lists prices. For specific information, click on the entry. Quality of information will be variable.
- Planetware.com‘s 15 top tourist attractions in Cairo and easy day trips;
- The Crowded Planet‘s 13 unique things to do in Cairo in 3 days; and
- TravelUSNews‘ 11 Best Things to do in Cairo.
Wikipedia makes a big point of the most popular sporting activity being Football (which Americans will know as Soccer). The last subsection of the Infrastructure section of their Cairo Page provides an excellent jumping-off point to explore this facet of the City. This is followed by a section on the Culture of the city which is also worth reading.
With this final update, this first serial blog post is now considered complete. The series itself continues; you can access the next part using the links below.

Discover more from Campaign Mastery
Subscribe to get the latest posts sent to your email.


January 3rd, 2018 at 10:17 pm
Updated Jan 3: Hobart entry done.
Mike Bourke recently posted..Beginnings And Legacies
January 5th, 2018 at 12:44 am
Updated Jan 4: Melbourne entry done.
Mike Bourke recently posted..Beginnings And Legacies
January 5th, 2018 at 10:41 pm
Updated Jan 5: Sydney entry done, photo montages created and uploaded.
Mike Bourke recently posted..Beginnings And Legacies
January 10th, 2018 at 12:55 am
Updated Jan 10: Brisbane entry done.
Mike Bourke recently posted..The Diversity Of Seasons Pt 1: Winter
January 10th, 2018 at 11:57 pm
Updated Jan 10: Tahiti entry done.
Mike Bourke recently posted..The Diversity Of Seasons Pt 1: Winter
January 12th, 2018 at 2:57 am
Updated Jan 11: Cairo entry done.
Mike Bourke recently posted..The Diversity Of Seasons Pt 1: Winter
January 12th, 2018 at 5:58 pm
Updated Jan 12: Final cleanup, post complete.
Mike Bourke recently posted..The Diversity Of Seasons Pt 1: Winter
August 16th, 2018 at 7:53 am
I learned so much about winter in so many different countries. So detailed and full of information. Thank you.
What was your favorite discovery?
August 17th, 2018 at 5:55 pm
Thanks, Jake. My favorite discovery wasn’t about any one location, it was more about the systemic appreciation of weather variables – how simple the basic rules of weather modelling could be, and yet how complex and unique the results were for any given location. I’ve never looked at weather conditions for any location quite the same way again. Of course, there’s a lot more in the series to go!