Trade In Fantasy Ch. 5: Land Transport, Pt 5b
- Trade In Fantasy: Preliminaries & Introduction
- Trade In Fantasy Ch. 1: Ownership
- Trade In Fantasy Ch. 2: Trade Units Pt 1
- Trade In Fantasy Ch. 2: Trade Units Pt 2
- Trade In Fantasy Ch. 3: Routine Personnel Pt 1
- Trade In Fantasy Ch. 3: Routine Personnel Pt 2
- Trade In Fantasy Ch. 3: Routine Personnel, Pt 3
- Trade In Fantasy Ch. 3: Routine Personnel, Pt 4
- Trade In Fantasy Ch. 4: Modes Of Transport, Pt 1
- Trade In Fantasy Ch. 4: Modes Of Transport, Pt 2
- Trade In Fantasy Ch. 4: Modes Of Transport, Pt 3
- Trade In Fantasy Ch. 4: Modes Of Transport, Pt 4
- Trade In Fantasy Ch. 4: Modes Of Transport, Pt 5
- Trade In Fantasy Ch. 5: Land Transport, Pt 1
- Trade In Fantasy Ch. 5: Land Transport, Pt 2
- Trade In Fantasy Ch. 5: Land Transport, Pt 3
- Trade In Fantasy Ch. 5: Land Transport, Pt 4
- Trade In Fantasy Ch. 5: Land Transport, Pt 5 (incomplete)
- Trade In Fantasy Ch. 5: Land Transport, Pt 5a
- Trade In Fantasy Ch. 5: Land Transport, Pt 5b
This post continues the text of Part 5 of Chapter 5. Its content has been added to the parent post here and the Table of contents updated.

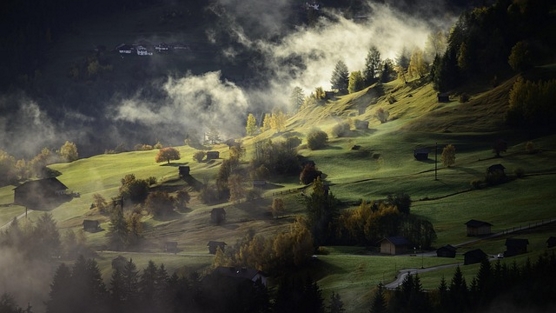
I have a series of images of communities of different sizes which will be sprinkled throughout this article. This is the first of these – something so sparsely-settled that it barely even qualifies as a community. It’s more a collection of close rural neighbors! Image by Jörg Peter from Pixabay
In general, the rule is one zone, one model. In fact, as a general rule, your goal should be one Kingdom, one model – that way, if you choose “England” as your model, your capital city will resemble London in size and characteristics, and not, say, Imperial Rome.
But, if you can think of a compelling enough reason, there’s no reason not to blend models. There are lots of ways to do this.
The simplest is to designate one model for part of a zone, and another to apply to the rest.
Example, if your capital city were much older than the rest of the Kingdom, you might decide that for IT ALONE, the Imperial model might be more appropriate, while the rest of the Kingdom is England-like. Or you might decide that because of its size, it has sucked up resources that would otherwise grow surrounding communities more strongly, and declare a three-model structure: Imperial Capital, France for all zones except zone 1, and England for the rest of Zone 1.
Example: A zone contains both swamp and typical agricultural land. You decide that those parts that are Swamp are German or Frontier in nature, while the rest are whatever else you are using.
An alternative approach to the problem that works in the case of the latter example is to actually average the two models’ characteristics and apply the result either to just the swamp areas, or to the zone overall.
When you get right down to it, the models are recommendations and guidelines, describing a particular demographic pattern seen in Earth’s history. There’s absolutely nothing to prevent you from inventing a unique one for a Kingdom in your world – except for it being a lot of work, that is.
I don’t really think that a fully-worked example is actually necessary at this point, but I need to have one up-to-date and ready to go for later in the article. So it’s time for another deep-dive into the Kingdom of Zomania.
I’ll start by picking a couple of Zones that look interesting, and distinctive compared to each other.
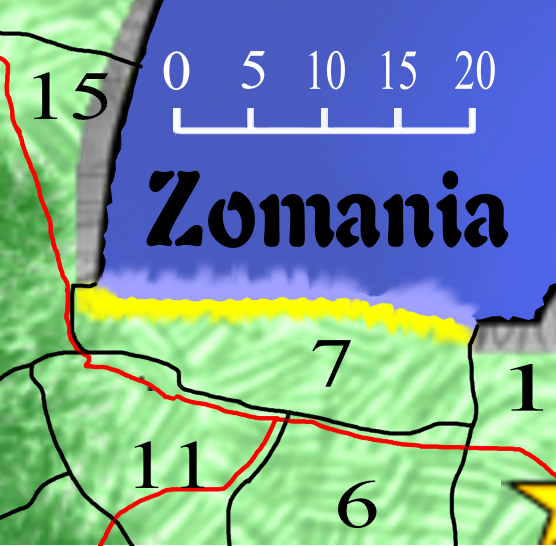
Zone 7 is bounded by a major road, but doesn’t actually contain that road; it DOES have capacity for a lot of fishing, though. And I note that there are cliffs in the zones to either side of it, so they WON’T support fishing – in fact, those cliffs appear to denote the limits of the zone..Zone 7 adds up to 167.8 units in area, and features 26 units of pristine beaches.
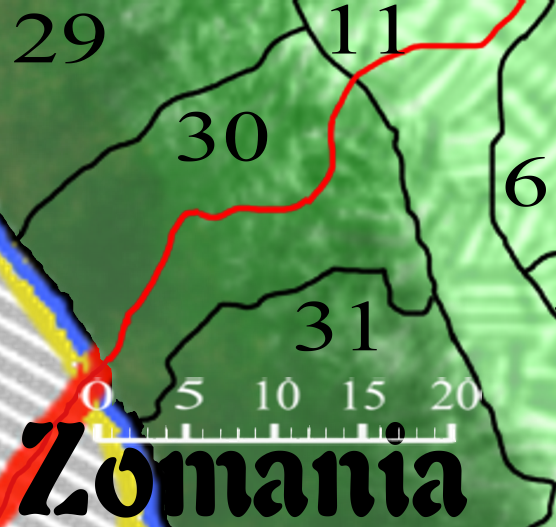
Zone 30 has an international border, and a major road, lots of forest and foothills becoming mountainous. It’s larger than one 7, at 251.45 units.
Because I haven’t detailed these areas at all, the place that I have to start is back in 5.7.1.13. But first…
5.8.1.6.7.1.1 Sidebar: Anatomy Of A Fishing Locus
I was going to bring this up a little later, but realized that readers need to know it, now.
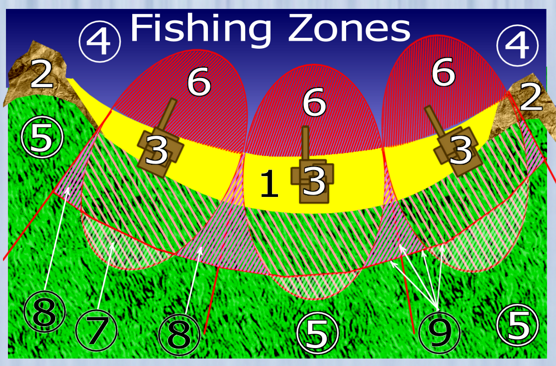
Coastal Loci are a little different to the normal. To explain those differences, I threw together the diagram below.
1: is a coast of some kind. It might not be an actual beach, but it’s flat and meets the water.
2: It’s normal, especially if there’s a beach, for the ends to be ‘capped’ with some sort of headland. This is often rocky in nature. This is the natural location for expensive seaside homes and lighthouses.
3. Fishing villages.
4. Water. It could be a lake, or the sea, or even a river if it’s wide enough.
5. Non-coastal land, usually suitable for agriculture.
6. A fishing village’s locus is compressed along the line of the coast and bulging out into the water. This territory produces a great deal more food than the equivalent land area – anywhere from 2-5 times as much. Some cultures can go beyond coastal fishing, doubling this area – though what’s further out than shown is generally considered open to anyone from this Kingdom. Beyond that, some cultures can Deep-Sea fish (if this is the sea), which quadruples the effective area again. If you’re keeping track, that’s 2-5 x 2 x 4 = 16-40 times the land area equivalent. The axis of the locus is always as perpendicular to the coast as possible.
7. The bottoms of the lobes are lopped off…
8. And the land equivalent is then found ‘squaring up’ the locuses…
9. …which means that these are the real boundaries of the locus. The area stays roughly the same, though.
The key point is this: you don’t have to choose “Coastal Mercantile” to simulate living on the coast and fishing for food. There are mechanisms already built into the system for handling that – it’s all done with Terrain and a more generous interpretation of “Arable Land”.
Save the “Coastal Mercantile” Model for islands and coastal cultures whose primary endeavor is water-based trade.
Zone 7, then, should have the same Model as all the other farmland within the Kingdom. I think France is the right model to choose.
Zone 30 is a slightly more complicated story. For a start, don’t worry about the road – like coastal villages, that gets taken care of later. For that matter, so is the heavy forestation, and the local geography – hills and mountains. But this is an area under siege from the wilderness, as explained in an earlier post. Which changes the fundamental parameters of how people live, and that should be reflected in a change of model. In this case, I think the Germany / Holy Roman Empire model of lots of small, walled, communities is the most appropriate.
But this does raise the question of where the change in profile takes place. I have three real options: The Zone in it’s entirety may be HRE-derived; or the HRE model might only apply to the forests; or might take hold in the hills and mountains, only.
My real inclination would be to choose one of the first two options, but in this case I’m going to choose door number 3m simply because it will contrast he HRE model with the base French version of the hills and forests. In fact, for that specific purpose, I’m going to set the boundary midway through the range of hills:
5.8.1.6.1.2 Sidebar: Elevation Classification
Which means, I guess, that I should talk about how such things are classified in this system. There are eight elevation categories, but the categories themselves are based on the differences between peak elevation and base elevation.
I tried, but couldn’t quite get this to be fully legible at CM-scale. Click on the image above to open a larger copy in a new tab.
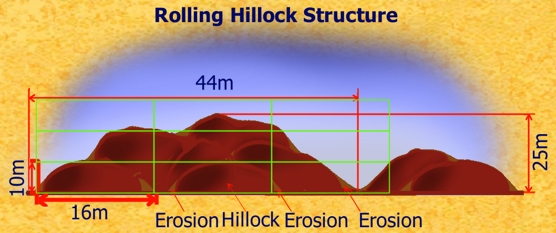
To get the typical feature size – the horizontal diameter of hills or mountains – divide 5 x the average of the Average Peak Elevation range by the average Relief range and multiply by the elevation category number, squared for mountains, or twice the previous category’s value, whichever is higher. Note that the latter is usually the dominant calculation! The results are also shown below. Actual cases can be 2-3 times this value – or 1/2 of it.
1. Undulating Hillocks – Average Peak Elevation 10-150m, Local Relief <50m; Features 16m (see below).
2. Gentle Hills – Average Peak Elevation 150-300m, Local Relief 50-150m; Features 32m.
3. Rolling Hills – Average Peak Elevation 300-600m, Local Relief 150-300m; Features 64m-> □ Zone 30 Treeline from the start of this category
-> □ Normal Treeline is midway through the range4. Big Hills – Average Peak Elevation 600-1000m, Local Relief 300-600m; Features 128m
5. Shallow Mountains – Average Peak Elevation 1000-2500m, Local Relief 600-1500m; Features 417m
6. Medium Mountains – Average Peak Elevation 2500-4500m, Local Relief 1000-3000m; Features 834 m
7. Steep Mountains – Average Peak Elevation 4500-7000m, Local Relief 3000-5000m; Features 1668m
8. Impassable Mountains, permanent snow-caps regardless of climate – Average Peak Elevation 7000m+, Local Relief 5000m+; Features 3336m.
Undulating Hillocks (also known as Rolling Hillocks or Rolling Foothills) are basically a blend of scraped-away geography and boulders deposited by glaciers. If the boulders have any sort of faults (and most do), they will quickly become more flat than round and start to tumble within the Glacier. When they come to rest, several will be stacked, on on top of another, generally in long waves. There will be gaps in between, which get filled with earth and mud and weathered rock over time, unless the rocks are less resistant to weathering than soil, in which case the rocks get slowly eaten away. In a few tens of thousands of years, you end up with undulating hillocks, or their big brothers. The flatter the terrain, the more opportunity there is for floodwaters to cover everything with topsoil, smoothing out the bumps. The diagram above shows how this ‘stacking and filling’ can produce structures many times the size of individual hillocks.
A very similar phenomenon – wind instead of glaciers, and sand instead of boulders – creates sandy dunes in deserts prone to that sort of thing. Over time, great corridors get carved out before and after each dune, generally at right angles to the prevailing winds. It can help you picture it if you think of the wind “rolling” across the dunes – when they come to a spot where the sand is a little less held together, it starts to carve out a trench, and before long, you have wave-shaped sand-dunes.

Zone 7 has a measured area of 167.8 units, but that needs to be adjusted for terrain. Instead of the slow way, estimating relative proportions, let’s use the faster homogenized approach:
Hostile Factors:
Coast 1.1 + Farmland 0.9 + Scrub 1.1 = 3.1; average 1.03333.
Coast +0.25 + Beaches -0.05 + Civilized -0.1 = +0.1
Towns -0.1
Net total: 1.03333
167.8 x 1.0333 = 173.4 units^2.
Benign Factors:
Town 0.1 + Coast 0.15 + Beaches 0.15 + Civilized 0.2
Subtotal +0.6
Square Root = 0.7746
173.4 x 0.7746 = 134.3 units^2.
Zone 30 is… messier. Base Area 251.45 units^2.
Hostile Factors:
Mining 1.5 +
Average (Mountains 1.4 + Forest 1.25 + Hills 1.2 = 3.85) = 1.28
Town -0.1 + Foreign Town 0.1 + River 0.2 + Caves 0.05 + Ruins 0.4 + “Wild” 0.1 = +0.75
Net total = 1.5 + 1.28 + 0.75 = 3.53
251.45 x 3.53 = 887.6 units^2.
Benign Factors:
Town 0.1 + Foreign Town -0.1 + River +0.1 + Caves 0.05 + Ruin 0.4 + Major Road 0.2
Subtotal 0.75
“Wild” = average subtotal with 1 = 0.875
Sqr Root = 0.935
887.6 x 0.935 = 829.9 units^2.

To me, this looks very Greek – but it’s actually ‘Gordes’ in England, which the photographer describes as a village. One glance is enough to show that it’s bigger than the town depicted previously. Image by Neil Gibbons from Pixabay
Zone 7 is pretty secure, the biggest threat being local insurrection or maybe pirate raids. A 4-lobe structure of 2½,5 looks about right.
When I measure out the area protected by a single fort and 4 satellites, I get 47.2 days^2. That takes into account overlapping areas where this one structure shares the burden 50% with a neighboring structure, and the additional areas that have to be protected by cavalry units.
That means that in Zone 7, there should be S x 134.3 / 47.2 = 2.845 x S of them, depending on the size of a “unit” on the map is, measured in days’ march for infantry.
S is going to be the same for all zones I’ve avoided making that decision for as long as I can – the question is, how large is Zomania?
5.8.1.6.5 Sidebar: The Size of Zomania, revisited
16,000 square miles – at least, that’s the total that I threw out in 5.7.1.3.
That’s about the same size as the Netherlands.
It’s a lot smaller than the Zomania that I’m picturing in my head when I look at the map. It IS the right size if the units shown are miles. But if they aren’t?
There are two reasons for regularly offering up Zomania as an example. The first is to provide a consistent foundation and demonstration of the principles discussed coming together into a cohesive whole. And the second is for me to check on the validity of the logic and techniques that I’ve described.
Feeling ‘wrong’ is keeping my subconscious radar from achieving purpose #2. And the Zomania being described being too small, which is the cause of that ‘wrong’ feeling, means that it isn’t going to adequately perform function #1, either.
There can be only one solution – Zomania has to grow, has to be scaled up. I want Zone 7 to be comparable to the size of the Netherlands, not the entire Kingdom, which should be comparable to France, or Germany, or England, or Spain.
A factor of 10? Where would 160,000 sqr miles place Zomania amongst the European Nations that I’ve named?
UK: 94,356. Germany: 138,063. Spain: 192,466. France: 233,032. So 160,000 would be smack-dab in the middle, and absolutely perfect for both purposes.
So Zomania is now 160,000 square miles, and the ‘units’ on all the maps are 10 miles each.
It wasn’t easy sorting this out – it’s been a road-block in my thinking for a couple of days now – triggered by results that seemed to show Zone 7 to be about 0.08 defensive structures in size.
And that is due to a second scaling problem that was getting in the way of my thinking:
How much is that in day’s marching?
In 5.7.1.14.3, I offered up:
If d=10 miles (low), that’s 103,923 square miles.
If d=20 miles (still low), that’s 415,692 square miles.
If d=25 miles (reasonable), that’s 649, 519 square miles.
If d=30 miles (doable), 935,307 square miles.
If d=40 miles (close to max), 1.66 million square miles.
If d=50 miles (max), 2.6 million square miles.But that was in reference to a theoretical 6 x 4, 12 + 12 pattern. Nevertheless, the scales are there. And they are way bigger than I thought they would be, and way to big to be useful as examples. Yet the logic that led to them seemed air-tight. Clearly, there was an assumption that had been made that wasn’t correct, but this problem was getting in the way of solving the first one.
Once I had separated the two, answers started falling into place. The numbers shown above are how far infantry can march in 24 solid hours, such as they might do in a dire emergency. But defensive structures would not be built and arranged on that basis.
If infantry march for 8 hours, they have just about enough daylight left to break camp in the morning (after being fed) and set up camp in the evening (digging latrines and getting fed). That’s the scale that would be used in establishing fortifications, not the epic scale listed. In effect, then, those areas of protection are nine times the size they should be.
So, let’s redo them on that basis:
If d=10 miles (low), that’s 11,547 square miles.
If d=20 miles (still low), that’s 46,188 square miles.
If d=25 miles (reasonable), that’s 72,169 square miles.
If d=30 miles (doable), 103,923 square miles.
If d=40 miles (close to max), 184,444 square miles.
If d=50 miles (max), 288,889 square miles.And those are still misleading, because mentally, I’m thinking of this as the area protected by the central stronghold, and ignoring the satellites. To get the area per fortification,, we should divide by the total number of fortifications in the pattern – in the case of the numbers cited, that’s 6×4+12=36.
If d=10 miles (low), that’s 320.75 square miles.
If d=20 miles (still low), that’s 1283 square miles.
If d=25 miles (reasonable), that’s 2,004.7 square miles.
If d=30 miles (doable), 2,886.75 square miles.
If d=40 miles (close to max), 5,123.4 square miles.
If d=50 miles (max), 8024.7 square miles.Reasonable = 2004.7 square miles, or roughly equal to a 44.8 x 44.8 mile area. For a really tightly packed defensive structure of the one being discussed, that’s entirely reasonable – and it fits the image in my head.
In my error-strewn calculation, my logic went as follows:
▪ In the inner Kingdom, I think that life is easy and lived fairly casually. That points to the lower end of the scale – 10 miles a day or 20 miles a day.
▪ 10^2 = 100, so at 10 mi/day, 16,000 = 160 days march.
▪ 20^2 = 400, so at 20 mi/day, 16,000 = 40 days march.▪ That’s a BIG difference. 40 is too quick, but 160 sounds a little too slow. Tell you what, let’s pick an intermediate value of convenience and work backwards.
▪ 100 days march to cover anywhere in 16000 square miles gives 160, and the square root of 160 is 12.65 miles per day.
Now, that logic’s not bad. But it doesn’t factor in the ‘working day’ of the infantry march – it needs to be divided by 3. And it DOES factor in my psychological trend toward making the defensive areas smaller, because my instinct was telling me they were too large – but this is the wrong way to correct for that. So this number is getting consigned to the dustbin.
After all, the ‘hostile’ and ‘benign’ factors are supposed to already take into account the threat level that these fortifications are supposed to address, and hence their relative density.
▪ So, let’s start with the “reasonable” 25 miles.
▪ Apply the ‘working day’ to get 8.333 miles.
▪ The measured area of the defensive structure is 47.2 ‘days march’^2.
▪ Each of which is 8.333^2= 69.444 miles^2 in area.
▪ So the defensive unit – stronghold and four satellites – covers 47.2 x 69.444 = 3277.8 sqr miles.
▪ Or 655.56 sqr miles each.
▪ Equivalent to a square 25.6 miles x 25.65 miles.
▪ Or a circle 12.51 miles in radius.
▪ Base Area 173.4 units^2 = 17340 square miles.
▪ Adjusted for threat level, 134.3 units^2 or 13430 square miles. In other words, defensive structures are further apart because there’s less threat than normal.
▪ 13430 / 3277.8 = 4.1 defensive structures, of 1 hub and 4 satellites each.
▪ So that’s 4 hubs and 16 satellites plus an extra half-satellite somewhere.Those satellites could be anything from a watchtower to a small fort to a hut with a couple of men garrisoned inside, depending on the danger level and what the Kingdom is prepared to spend on securing the region. The stronghold in the heart of the configuration needs to be more substantial.
Okay, so that’s Zone 7. Zone 30 is a whole different kettle of fish.
I wanted to implement a 3-lobed configuration with more overlap than the four-lobed choice made for Zone 7. And it was turning out exactly the way I wanted it to; some every hub was reinforced by three satellites, every satellite reinforced by three hubs. I had the diagrams 75% done and was gearing up to measure the protected area.
Which is when the plan ran aground in the most spectacular way. There were areas where responsibility was shared two ways, and three ways, and four ways, and – at some points – six ways. It was going to take a LONG time to measure and calculate.
If I were creating Zomania as an adventuring location for real, I would have carried on. If I lived in an ideal world, without deadlines (even the very soft ones now in place at Campaign Mastery) I would have continued. I still think that it would have provided a more enlightening example for readers, because I would be doing something a little bit different and having to explain the differences and their significance.
But since neither of those circumstances is the case, and this post is already several days late due to the complications explained earlier, I am going to have to compromise on principle and re-use the configuration established for Zone 7.
Well, at least that will show the impact that the greater threat level will impose on the structure, but it leaves the outer reaches of the Kingdom less well-protected than they should be. If and when I re-edit this series into an e-book, I might well spend the extra time and replace the balance of this section – or even work the problem both ways for readers’ edification.
REMINDER TO SELF – 3 LOBES, 1 DAY EXAMPLE
But, in the meantime…
Zone 30.
▪ Actual area 251.45 square units = 25,145 square miles.
▪ Adjusted for threat level = effective area 829.9 square units = 82,990 sqr miles. (in other words, the defensive structures you would expect to protect 82,990 square miles are so closely packed that they actually protect only 25,145 square miles, a 3.3-to-1 ratio.)
▪ Defensive Structure = 3277.8 square miles (from Zone 7).
▪ 82,990 / 3277.8 = 25.32 defensive structures of 5 fortifications each, or 126.6 fortifications in total. Zone 7 is 69% of the area and had a total of 20.5 fortifications, in comparison.What does 0.32 defensive structures represent? Well, if I take the basic structure and ‘lop off’ two of the satellites, then it’s 3/5 of a protected area minus the overlaps. By eye, those overlaps look to be a bit more than 2 x 1/4 of one of those 1/5ths, and since 1/4 of 1/5 is 1/20th, that’s roughly 0.6-0.1 = 0.5.
If I take away a third satellite, the structure is down to 2/5 protected area minus overlaps, and those overlaps are now 1 x 1/20th, so 0.4-0.05=0.35. So, somewhere on the border, there’s a spot with one hub and one satellite.
One more point: 3.3 to 1. What does THAT really mean? Well, the defensive structure used has satellites 2.5 days march from the hub. But everything is more compressed, by that 3.3:1 ratio, so the satellites in Zone 30 are actually 2.5 / 3.3 = 0.76 day’s march from the hub. The area each commands is still the same, but there’s a lot more overlap and capacity to reinforce one another.
Another way to look at it is that there are so many fortifications that each only has to protect a smaller area. 3277.8 sqr miles / 3.3 = 993 sqr miles.
5.8.1.6.6 Sidebar: Changes Of Defensive Structure
The point that I’m going to make in this sidebar won’t make a lot of sense unless you’re paying close attention, because the Zone 30 example has the same defensive structure as Zone 7 – it’s just a lot more compressed. But imagine for a moment that there was a completely different defensive structure in Zone 30.
What does that imply for Zone 11, which lies in between the two?
You might think that it should be some sort of half-way compromise or blend between the two, but you would be wrong to do so.
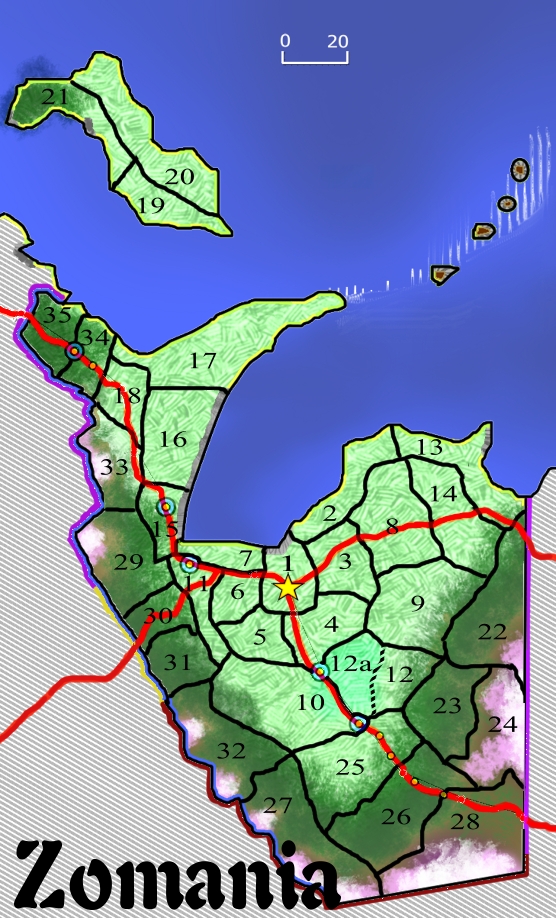
If you look back at the overall zone map for Zomania (reproduced below)
…and recall that the zones are numbered in the order they were established, a pattern emerges. Zone 1 first, then Zone 2, then Zones 3-4-5-6-7, then zones 8-9-10-11-12, and so on. Until Zones 29-32 were established, Zone 11 was the frontier. it would likely have the same defensive structure as Zone 30. Rather than fewer fortifications, it would have them at the same density as Zone 30 – but the manpower in each would be reduced.
If you know how to interpret it, the entire history of the Kingdom should be laid bare by the changes in its fortifications and defenses.
But that’s not as important as the verisimilitude that you create by taking care of little details like this and keeping them consistent. The specifics might never be overtly referenced – but they still add a little to the credibility of the creation.
Zone 7 is noteworthy for NOT having a major road – that’s on the Zone 11 / Zone 6 side of the border. Some of the inns along that road, however, may well be over that border – it’s a reasonable expectation that half of them would count. But only that half that is located where the border runs next to the road – there’s a section at the start and another at the end where the border shifts away.
But there’s a second factor – what is the sea, if not another road to travel down? And Zone 7 has quite a lot of beach. The reality, of course, is that these are holiday destinations, and places for health recovery – but it’s a convenient way of placing them.
So that’s two separate calculations. The ‘road that is a road’ first: There are actually two sections. The longer one runs through Zones 6 and 11, as already noted; it measures out at 15 units long, or 150 miles.
The second lies in Zone 15, and it’s got a noticeable bend in it. If I straighten that out and measure it, I get 5 units or 50 miles.
Conditions:
Road condition, terrain, good weather = 3 x 2.
Load = 1 x 1/2.
Everything else is a zero.
Total: 6.5.
6.5 / 16 x 3.1 = 1.26 miles per hour.
1.26 mph x 9 hrs = 11.34 miles.
Here’s the rub: we don’t know exactly where the hubs and satellites are in Zone 7, only how many of them that there are to emplace. But it seems a sure bet that those areas where the road and border part ways, do so because there’s a fortification there that answers to Zone 6 or Zone 11, respectively. And that means that we can treat the entire length of the road as being between two end points.
We know from the defensive structure diagram that the base distance from Satellite to Hub is 2 1/2 days march, and that there’s a scaling of x 1.0333 (hostile) x 0.7746 (benign) = x 0.8 – and that benign factors space fortifications further apart while hostile ones bunch them together, so this is a divided by when calculating distances. We know that 8.333 miles has been defined as a “day’s march”.
If we put all that together, we get 2.5 x 8.333 / 0.8 = 26 miles from satellite to hub.
Armies like their fortifications on roads, it makes it faster to get anywhere. Traders like their trade routes to flow from fortification to fortification, it protects them from bandits. The general public, ditto. If a road doesn’t go to the fortification, people will create a new road and leave the official one to rot. So it can be assumed that the line of fortifications will follow the road, and be spaced every 26 miles along it, alternating between hub and satellite.
150 miles / 26 = 5.77 of them.
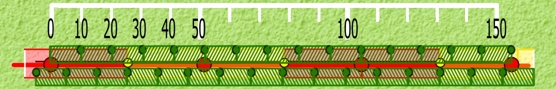
It’s an imperfect world; that 0.77 means that you have one of three situations, as shown below:
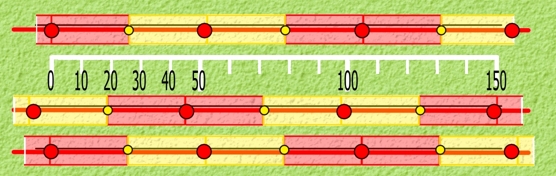
The first figure shows a hub at the distant end of the road. The first shows a hub at the end of the road closest to the capital. And the third shows the hubs not quite lining up with either position.
But those aren’t the actual ends of the road – this is just the section that parallels the border of Zone 7, or vice-versa. So the last one is probably the most realistic
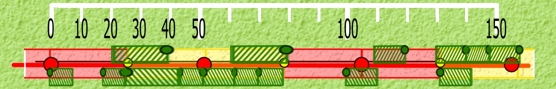
Now, let’s place Inns – one every 11.34 miles. But we have to do them from both ends – one showing 1 day’s travel for ordinary people headed out, and one showing them heading in. Just because I’m Australian, and we drive on the left, I’ll put outbound on the south side and inbound on the north.
Isn’t that annoying? The don’t quite line up – to my complete lack of surprise. Look at the second in-bound inn – it’s about 20% of a day short of getting to the satellite, and that puts it so close that it’s not worth stopping there; you would keep going.
Well, you can’t make a day longer, but you can make it shorter. And that makes sense, because these are very much average distances.
I’ve shortened the days for the ordinary traveler – including merchants – just a little, so that every 5th inbound Inn is located at a Stronghold, and every 5th outbound inn is located at a satellite. Every half-day’s travel now brings you to somewhere to stop for a meal or for the night.
It’s entirely possible that not all of these Inns will actually be in service, it must be added. Maybe only half of them are actually operating. Maybe it’s only 1/3. But, given it’s position within the Kingdom, there’s probably enough demand to support most of these, so let’s do a simple little table:
1 inn functional
2 inn functional
3 inn functional but 1/4 day closer
4 inn functional but 3/4 day farther away
5 inn not functional
6 inn not functional, and neither is the next one.
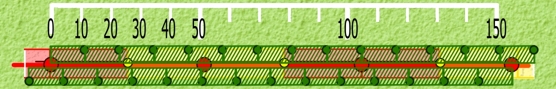
Applying this table produces the following (for some reason, my die kept rolling 3s and 6s):
Even here, in this ‘safe’ part of the Kingdom, travelers will be forced to camp by the roadside.
And that’s where I’ll have to leave it, for this post. I had hoped to get all of the Zomania examples done, but the problems early on put paid to that, and didn’t even leave me enough time to get Zone 30 detailed through to the inn stage – let alone up to date! That’s obviously for the next post….

Discover more from Campaign Mastery
Subscribe to get the latest posts sent to your email.


Leave a Reply