Trade In Fantasy Ch. 5: Land Transport, Pt 3
- Trade In Fantasy: Preliminaries & Introduction
- Trade In Fantasy Ch. 1: Ownership
- Trade In Fantasy Ch. 2: Trade Units Pt 1
- Trade In Fantasy Ch. 2: Trade Units Pt 2
- Trade In Fantasy Ch. 3: Routine Personnel Pt 1
- Trade In Fantasy Ch. 3: Routine Personnel Pt 2
- Trade In Fantasy Ch. 3: Routine Personnel, Pt 3
- Trade In Fantasy Ch. 3: Routine Personnel, Pt 4
- Trade In Fantasy Ch. 4: Modes Of Transport, Pt 1
- Trade In Fantasy Ch. 4: Modes Of Transport, Pt 2
- Trade In Fantasy Ch. 4: Modes Of Transport, Pt 3
- Trade In Fantasy Ch. 4: Modes Of Transport, Pt 4
- Trade In Fantasy Ch. 4: Modes Of Transport, Pt 5
- Trade In Fantasy Ch. 5: Land Transport, Pt 1
- Trade In Fantasy Ch. 5: Land Transport, Pt 2
- Trade In Fantasy Ch. 5: Land Transport, Pt 3
- Trade In Fantasy Ch. 5: Land Transport, Pt 4
- Trade In Fantasy Ch. 5: Land Transport, Pt 5 (incomplete)
- Trade In Fantasy Ch. 5: Land Transport, Pt 5a
- Trade In Fantasy Ch. 5: Land Transport, Pt 5b
While working on the subject of population and its distribution, I stumbled onto a method of using a Realm’s economics for worldbuilding and history generation. Originally subordinated to the main thread, I’ve decided to break it out into it’s own post. Note that the unfinished part that’s been set aside for the next post is already slightly larger in wordcount than this one (but it is almost finished)!

Ledger image by RaphaelQS, CC0, via Wikimedia Commons. The dragon shadow was created from dragon-3176769.png, original image by Gordon Johnson from Pixabay, manipulated by Mike
Table Of Contents
In part 1:
Chapter 5: Land Transport
5.1 Distance, Time, & Detriments
5.1.1 Time Vs Distance
5.1.2 Defining a terrain / region / locality5.1.2.1 Road Quality: An introductory mention
5.2 Terrain
5.2.0 Terrain Factor
5.2.1 % Distance
5.2.2 Good Roads
5.2.3 Bad Roads
5.2.4 Even Ground
5.2.5 Broken Ground
5.2.5 Marshlands
5.2.7 Swamplands
5.2.8 Woodlands
5.2.9 Forests
5.2.10 Rolling Hills
5.2.11 Mountain Slopes
5.2.12 Mountain Passes
5.2.13 Deserts
5.2.14 Exotic Terrain
5.2.15 Road Quality
5.2.15.1 The four-tier system
5.2.15.2 The five-tier system
5.2.15.3 The eight-tier system
5.2.15.4 The ten-tier system5.2.16 Rivers & Other Waterways
5.2.16.1 Fords
5.2.16.2 Bridges
5.2.16.3 Tolls
5.2.16.4 Ferries
5.2.16.5 Portage & Other SolutionsIn Part 2:
5.3 Weather
5.3.1 Seasonal Trend
5.3.2 Broad Variations
5.3.3 Narrow Variations
5.3.3.1 Every 2nd month?
5.3.3.2 Transition Months
5.3.3.3 Adding a little randomness: 1/2 length variations
5.3.3.4 Adding a little randomness: 1 1./2-, 2-, and 2 1/2-length variations5.3.4 Maintaining The Average
5.3.4.1 Correction Timing
5.3.4.1.1 Off-cycle corrections
5.3.4.1.2 Oppositional Corrections
5.3.4.1.3 Adjacent corrections
5.3.4.1.4 Hangover corrections5.3.4.2 Correction Duration
5.3.4.2.1 Distributed corrections: 12 months
5.3.4.2.1.1 Even Distribution
5.3.4.2.1.2 Random Distribution
5.3.4.2.1.3 Weighted Random Distribution5.3.4.2.2 Distributed corrections: 6 months
5.3.4.2.3 Distributed corrections: 3 months
5.3.4.2.4 Slow Corrections (2 months)
5.3.4.2.5 Normal corrections: 1 month
5.3.4.2.6 Fast corrections: 1/2 month (2 weeks)
5.3.4.2.7 Catastrophic corrections 1/4 month (1 week)5.4.4.3 Maintaining Synchronization
5.4.4.4 Multiple Correction Layers5.4 Losses & Hazards
5.5 Expenses – as Terrain Factors
5.6 Expenses – as aspects of PoliticsToday
5.7 Inns, Castles, & Strongholds
5.7.1 Strongholds
5.7.1.1 Overall Military Strength
5.7.1.1.1 Naval Strength
5.7.1.1.2 Exotic Strength
5.7.1.1.3 Adjusted Military Strength5.7.1.2 Mobility
5.7.1.2.1 Roads
5.7.1.2.2 Cross-country5.7.1.3 Kingdom Size and Capital Location
5.7.1.4 Borders
5.7.1.5 Terrain
5.7.1.6 Internal Threat
5.7.1.7 Priority
5.7.1.8 Threat Level
5.7.1.9 Zones
5.7.1.9.1 Abstract Zones
5.7.1.9.2 Applied Considerations
5.7.1.9.2.1 Sidebar: Why do it this way?5.7.1.9.3 Preliminary Zones, Zomania
5.7.1.10 Kingdom Wealth
5.7.1.10.1 Legacy Defenses
5.7.1.10.2 Military Training
5.7.1.10.3 Disaster Relief
5.7.1.10.4 Religion
5.7.1.10.5 Magic
5.7.1.10.6 Tools
5.7.1.10.7 Entertainment
5.7.1.10.8 Resource Development
5.7.1.10.9 A Hypothetical Disaster
5.7.1.10.10 Housing & Funding Boosts
5.7.1.10.11 Food
5.7.1.10.12 Diplomacy
5.7.1.10.13 Trade
5.7.1.10.14 Education
5.7.1.10.15 Transport (Road Maintenance)
5.7.1.10.16 The Impact On Population5.7.1.11 Military Need: Theoretical Scenario 2
Next Time (work in progress):
5.7.1.12 Stronghold Density
5.7.1.13 Zone Size
5.7.1.14 Base Area Protected per Stronghold
5.7.1.14.1 The Distance between defensive centers
5.7.1.14.2 The relationship between defensive patterns
5.7.1.14.3 The shape of the defensive pattern
5.7.1.14.4 What is 100% coverage, anyway?
5.7.1.14.5 Calculating Area Protected
5.7.14.5.1 Three Satellite
5.7.14.5.2 Four-Satellite5.7.1.14.6 Configuration Choice(s)
5.7.1.14.7 The Impact On Roads
5.7.1.14.8 The Impact on populations5.7.1.15 Economic Adjustments
5.7.1.16 Border Adjustments
5.7.1.17 Historical vs Contemporary Structures
5.7.1.18 Fixed Forces
5.7.1.19 Mobile Forces
5.7.1.20 Reserves
5.7.1.21 Zone and Kingdom Totals5.7.2 Castles
5.7.3 Inns5.8 Villages, Towns, & Cities
5.8.1 Villages
5.8.1.1 Village Frequency
5.8.1.2 Village Initial Size
5.8.1.3 The Generic Village5.8.2 Towns
5.8.2.1 Towns Frequency
5.8.2.2 Town Initial Size
5.8.2.3 The Generic Town5.8.3 Cities
5.8.2.2 Small City Frequency
5.8.2.3 Small City Size
5.8.2.4 Size Of The Capital
5.8.2.5 Large City Frequency
5.8.2.6 Large City Size5.8.4 Economic Factors, Simplified
5.8.4.1 Trade Routes & Connections
5.8.4.2 Local Industry
5.8.4.3 Military Significance
5.8.4.4 Scenery & History
5.8.4.5 Other Economic Modifiers
5.8.4.6 Up-scaled Villages
5.8.4.7 Up-scaled Towns
5.8.4.8 Up-scaled Small Cities
5.8.4.9 Upscaling The Capital & Large CitiesIn future parts of this chapter
5.8.5 Overall Population
5.8.5.1 Realm Size
5.8.5.2 % Wilderness
5.8.5.3 % Fertile
5.8.5.4 % Good
5.8.5.5 % Mediocre
5.8.5.6 % Poor
5.8.5.7 % Dire
5.8.5.8 % Wasteland
5.8.5.9 Net Agricultural Capacity5.8.5.10 Misadventures, Disasters, and Calamities
5.8.5.11 Birth Rate per year
5.8.5.12 Mortality
5.8.5.12.1 Infant Mortality
5.8.5.12.2 Child Mortality
5.8.5.12.3 Teen Mortality
5.8.5.12.4 Youth Mortality
5.8.5.12.5 Adult Mortality
5.8.5.12.6 Senior Mortality
5.8.5.12.7 Elderly Mortality
5.8.5.12.8 Venerable Mortality
5.8.5.12.9 Net Mortality5.8.5.13 Net Population
5.8.6 Population Distribution
5.8.6.1 The Roaming Population
5.8.6.2 The Capital
5.8.6.3 The Cities
5.8.6.4 Number of Towns
5.8.6.5 Number of Villages
5.8.6.6 Hypothetical Population
5.8.6.7 The Realm Factor
5.8.6.8 True Village Size
5.8.6.9 True Town Size
5.8.6.10 Adjusted City Size
5.8.6.11 Adjusted Capital Size5.8.7 Population Centers On The Fly
5.8.7.1 Total Population Centers
5.8.7.2 The Distribution Table
5.8.7.3 The Cities
5.8.7.4 Village or Town?
5.8.7.5 Size Bias
5.8.7.5.1 Economic Bias
5.8.7.5.2 Fertility Bias
5.8.7.5.3 Military Personnel
5.8.7.5.4 The Net Bias5.8.7.6 The Die Roll
5.8.7.7 Applying Net Bias
5.8.7.8 Applying The Realm Factor
5.8.7.9 The True Size
5.8.7.9.1 Justifying The Size
5.8.7.9.2 The Implications5.9 Compiled Trade Routes
5.9.1 National Legs
5.9.2 Sub-Legs
5.9.3 Compounding Terrain Factors
5.9.4 Compounding Weather Factors
5.9.5 Compounding Expenses
5.9.6 Compounding Losses
5.9.7 Compounding Profits
5.9.8 Other Expenses
5.9.9 Net Profit5.10 Time
5.11 Exotic TransportAnd, In future chapters:
- Waterborne Transport
- Spoilage
- Key Personnel
- The Journey
- Arrival
- Journey’s End
- Adventures En Route

5.7 Inns, Castles, & Strongholds
I’ve drawn a lot of inspiration from a game supplement that I downloaded many years ago, but it suffered from some profound flaws, not least of which being that you had to determine the total population of a kingdom or realm with little or no support from their system. Once you had done so, everything else fell out of the system in a fairly straightforward manner – so many villages of this size, so many towns of that, so many cities, and so on. Everything but where to put them, and what size the town over the next hill was going to be.
The intention is to do things a little better. No, a lot better. I want GMs to be able to work out what the population should be, taking everything possible into account. I then want to use a simplified version of the process from that game supplement that works to determine the distribution of that population. And then, a system that doesn’t require you to have placed all of these on a map, that lets the GM determine exactly what size the community over the next hill is going to be, taking into account all the relevant factors, so that the whole process is sandboxed, and a map can be built up over time and travels from A to B by the PCs.
A lot of systems that I have seen take the village size and work out what the reasons are. That can be a stimulus to the imagination, but this system will let the GM decide the relevant facts and from them, the consequences, assigning meaning to the size of a community – and telling him exactly what goods and services the PCs are likely to find.
Because of this layered approach, if your game world is different in some way, you can build in any variations that you need and see what the consequences and implications are, instead of making ad-hoc assumptions, plucking critical numbers out of thin air, and getting hamstrung when those numbers turn out to be wrong, requiring you to go back to square one repeatedly.
My method may seem like a lot more work – but it’s actually a shortcut direct to meaningful results.
And it starts here, by looking at three types of infrastructure component that are so dependent on factors outside basic population that they will tie you in knots if you try to make them dependent on settlement size. Instead, we’ll allocate them and use them as factors contributing to settlement size.
5.7.1 Strongholds
What is a stronghold? It’s a fortified point, basically. That fortification extends beyond local defenses; it’s all about the ability to project military power over an area. It could be a tower, a fort, an outpost, or anything else short of a full-blown castle.
These are expensive to build – the crown has to pay for them, and has to pay the soldiers to man them, and has to equip those soldiers and make sure that they are fed and their needs met.
Two things decide how many of them there are: economics and need. Economics, because – as I said – they have to be paid for, and need, because you don’t want to pay for any that aren’t needed. Things get interesting when one or both factors have changed over time, because in a Fantasy Game, these things tend to last until forcibly removed from the landscape.
So we’re looking at answering the question of how militarily secure a kingdom or other fantasy realm is – I’ll just use Kingdom for short. The answer is defined in terms of time – how long it will take a military force to leave the stronghold and travel to the trouble spot.
So Mobility is going to be a key factor. And Terrain. And History. And Priority, because no Kingdom can ever afford to be as secure as they would ideally like to be. And Military Capability, and how much of that capability is held in Reserves.
Why keep any of it in Reserves? Because the one reserve force can be dispatched to many possible locations at need, in whole or in part. The Military effectiveness of the reserves is therefore multiplied by the number of strongholds they can reinforce, and that permits the on-station personnel to be reduced in number – and therefore to cut expense, which frees money up to be spent elsewhere.
What’s more, it’s not going to be uniform throughout the Kingdom. There’s an inner core that’s going to be relatively strongly held, there’s a Zone around that which will be only weakly held, and a zone around that which is a little more variable – in some places it will be even weaker, in others it can be as strong as the central core or stronger.
And these zones are going to be subdivided according to threat level. If the Kingdom has been at peace with a neighbor for a long time, with a relatively stable border, there will be a downgrading of military need in the nearby parts of the kingdom; and if there’s a history of invasion, or uncivilized wilds abut the Kingdom, all sorts of things can come out of the undergrowth without warning, which will increase the military need.
It also has to be remembered that most armies are conscripted from the locals at hand. Standing armies are kept as small as possible, because everyone serving in a standing army is not being productive in any other area – they aren’t growing food or functioning economically except as a source of income, redistributing wealth from the crown (acquired in the form of taxes) to the professionals in the middle class, and from them to the people providing the fundamental resources – the lowest tier of society, the farmers, loggers, and miners.
If the Kingdom has expanded, historically, there may be several such rings. If the Kingdom is a significant naval power, the central core might be on the coast or it might be in a heartland a long way removed from it; if they aren’t, then the heartland is the only answer. If the Kingdom has contracted, then one or more of these zones may have been shed, in whole or in part, and now lie outside its boundaries, held by someone else.
Are you starting to get a handle on just how complicated all this can get?
Fortunately, we can keep it all fairly abstract at the moment – the key outcome that we want is the percentage of the population who serve in the military in each of these zones.
Give the Kingdom a rating out of 5. Use a single decimal place if you feel the need to nuance it just a little. Higher is stronger. After various things are done to this value, it will get divided by ten to become a percentage.
Give the naval strength of the Kingdom a rating out of five, higher is stronger. Don’t fret if the rating you assign is higher than the overall, but bear in mind that the higher this value is, the more of the overall value will be deemed to derive from it.
In a fantasy world, there are other sources of military strength. In essence, though, this comes down to Mages, Clerics, and Magical equipment within the military. Give the Kingdom a rating out of 5 for these factors in combination.
As a general rule, 30% of the overall military rating will come from the naval power and 70% from ground troops. In some cases, that may vary.
However, the Naval strength gets boosted by 30% of the exotic strength rating – they don’t get the full amount because there’s limits to how useful they are at a naval level. And the overall military strength gets multiplied by the other half.
AMS1 = [OMS × ES / 2] – [NS + (ES/2)] × 0.3
but we also need to take the Exotic strength back out of the result so that we are left with a measure directly related to manpower.
AMS2 = AMS1 × 2 / ES
Let’s plug in some numbers as examples:
OMS = 3.5 ES = 2 NS = 2
AMS1 = [OMS × ES / 2] – [NS + (ES/2)] × 0.3
= [3.5 × 2 / 2] – [2 + (2/2)] × 0.3
= 3.5 – 3 × 0.3
= 3.5 – 0.9 = 2.6
AMS2 = AMS1 × 2 / ES
= 2.6 × 2 / 2 = 2.6
OMS = 3.5 ES = 3 NS = 4
AMS1 = [OMS × ES / 2] – [NS + (ES/2)] × 0.3
= [3.5 × 3 / 2] – [4 + (3/2)] × 0.3
= [3.5 × 1.5] – [4 + 1.5] × 0.3
= 5.25 – 5.5 × 0.3
= 5.25 – 1.65 = 3.6
AMS2 = AMS1 × 2 / ES
= 3.6 × 2 / 3
= 7.2 / 3 = 2.4
OMS = 3.5 ES = 4 NS = 2
AMS1 = [OMS × ES / 2] – [NS + (ES/2)] × 0.3
= [3.5 × 4/2] – [2 + (4/2)] × 0.3
= [3.5 × 2] – [2 + 2] × 0.3
= 7 – 4 × 0.3
= 7 – 1.2 = 5.8
AMS2 = AMS1 × 2 / ES
= 5.8 × 2 / 4
= 5.8 / 2
= 2.9
AMS1 is the overall effective strength of the army, cavalry, etc – the land forces – and AMS2 is how much of that comes from the number of men in service.
It’s important also to note that the use of magic is a force multiplier, just the same as the use of advanced technology. Other Force Multipliers will arise in the course of this examination, and they have to be treated the same way – they mean that individual soldiers have a disproportionate impact on the battlefield.
Mobility is a key factor identified in the subsection introduction. It, too, is a force multiplier – but because it can be <1, under some circumstances, it actually reduces combat effectiveness.
At this point, because they have different mobilities, we also need to distinguish branches of the military – cavalry etc vs infantry. Every military installation will have a mixture – both branches can range from 0% to 100%, but ratios of 1 cavalry unit to every 5, 10, or 20 infantry are quite common at the low end for mobile forces and 5, 6, 7, or 8 to every 4 infantry units at the high end.
The exact mix in any given installation is going to vary. A military unit’s strength gets divided by the ‘Distance in days of travel’ to get their ability to project power; the larger the area that a given installation has to protect, the more they will lean on cavalry because they are inherently more mobile.
An infantry unit projects it’s full power for 1 day’s travel outwards, then 1/2 at 2 days, 1/3 at 3 days, 1/4 at 4 days, and so on. If you add up that series, you get an ultimate total of infinity, which is of no use to us, but there’s a practical consideration here – just how far are the military units required to be able to project power? That sets an upper limit to the number of terms, and hence the overall effectiveness.
A cavalry unit projects it’s full power for 3 day’s travel outwards, then 1/2 at 5 days, 1/4 at 7 days, and 1/8 at 10 days. At 14 days travel, the strength is 1/16th. But, again, there’s a practical limit – in this case, because cavalry units are expensive in every way, 7 days from the place where they are based is an absolute practical limit; beyond that, it gets cheaper to set up a new defensive installation and divide the cavalry units between the two.
Cavalry moves at about 3 times the speed of infantry, so if we assume the same limit to projection of power, we get 21 days travel as an absolute limit – but again, that’s massively inefficient. At 1/21 power, the benefit that they can bring to bear on a problem is essentially nil. It’s far more reasonable to look at the 1/4 of cavalry and use that as the basis of reasonable estimates of infantry expectations. 1/5 isn’t that much smaller than 1/4 – it’s 0.05 – but 1/6 is more significant at 0.08333333. So I would, on that basis, use the 7 days number, where the difference tops 0.1 for the first time.
Infantry: 1 + 1/2 + 1/3 + 1/4 + 1/5 + 1/6 + 1/7 = 2.593.
(Probably more precision than necessary).
Cavalry: 1 + 1 + 1 + 1/2 + 1/2 + 1/4 + 1/4 = 4.5.
Mobility is a force multiplier.
If a given installation is 70% infantry and 30% cavalry – not at all unreasonable – and it starts at the average military strength (AMS2) of 2.9, as per the third example earlier, then:
2.9 × 70% × 2.593 = infantry strength = 5.26379
2.9 × 30% × 4.5 = cavalry strength = 3.915
Total strength of installation: (5.26379 + 3.915) × ES/2
= 9.17879 × 4 / 2 = 18.35758
What does this mean? That for the given mixture of forces, 7:3 infantry-to-cavalry, their effectiveness is that of a force 18.36 times the size. Does that seem reasonable?
Well, let’s see. ES =4, which means that there’s a lot of use of magic on the battlefield, and low-level magic weapons are likely to be standard issue. So, 3 cavalry, 7 infantry, 1 mage and 1 cleric, all with + 1 weapons ( + 2 in some cases maybe) and + 1 armor. Would that be the equivalent of 18 ordinary people with ordinary swords and armor and no magic – with a little bit left over? As a GM, I would expect the military group to win easily, given any level of military training and/or experience. But they would take injuries, maybe even losses, in the process. Take away that training / experience, and they would probably still win – but losses would be higher, and it wouldn’t be quite as certain. Give the 18 a defensive position, and the balance of probabilities shifts in the other direction – probably enough to make it a 50-50 battle. So yes, given what we’ve taken into account thus far, this seems reasonable.
But here’s the thing: We aren’t looking for the military effectiveness; we want to make the force as small as possible in order to achieve the defined overall effectiveness of – in this example – 2.9.
So we want to scale the 2.9 back, not project it forward.
AMS3I (I for infantry) = 2.9 / 2.593 = 1.1184
AMS3C (C for cavalry) = 2.9 / 4.5 = 0.6444
AMS3T (T for total) = 1.1184 + 0.6444 = 1.7628.
That means that for the territory it protects to be protected to a strength of 2.9, we only need a strength of.1.7628. As implied earlier, these values are in tenths of a percentage point, so 0.17628% of the population within the protected area serve in this hypothetical installation.
So far.
Good roads benefit both infantry and cavalry, doubling the area they can protect at the same strength. Which means that in areas where the roads are good, you only need 1/2 as many fortifications.
Cross-country doesn’t bother cavalry too much but distresses infantry slightly – depending on the nature of the terrain. Other terrains have the opposite effect. Since we haven’t dealt with terrain yet, this might seem a complicating factor – but it’s not so. By definition, there are only the two, and if roads are adding a modifier, then cross-country must be what we’ve already defined. So, no problem at all – unless the terrain itself is a factor, something that I’ll get to in due course.
Draw a simple freehand map of the Kingdom on a piece of paper. Do it fast, but be reasonably accurate; there’s a lot of leeway, here. Which sides are flatter – the top & bottom or the left & right? Whichever one it is, that’s your baseline.
Draw boxes parallel to the baseline to a height or width such that as much of the kingdom on the line of that box is inside the box as it is outside.
How many boxes you do is up to you, but repeat until you’ve done the entire Kingdom.
Use the map scale to estimate the area of each box. Add those up to get an approximate total area for the kingdom – we’ll need it later.
Finally, make a critical decision: where do you want the Historical Capital to be? This may not be the capital any more, another city may have usurped it’s primacy, but everything we’re doing in this section is based on the historical, so we use the old capital.
Let me show you some examples:
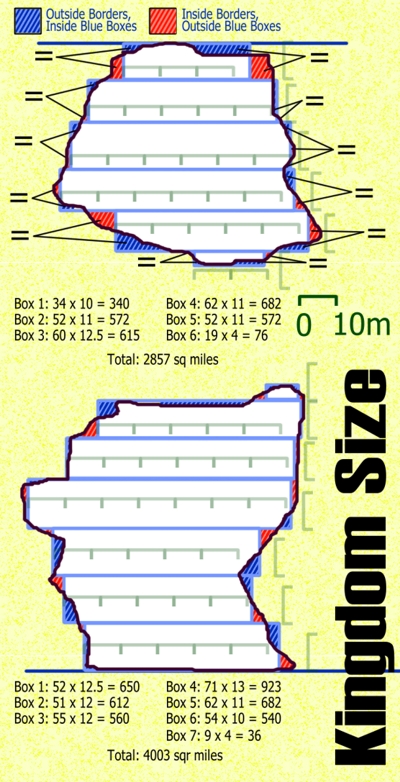
Here are two examples. The first one shows more of the working. I set the height of the boxes by eye to be roughly one scale division since the scale is 10 miles. This map used 6 rows – the more rows you use, the more accurate your estimate of area, but 6 is enough for a reasonable estimate. The blue boxes are positioned and given widths so that the area inside the borders but outside the boxes is roughly equal to the area outside the borders but inside the boxes. It’s not quite perfect – rows 2, 3, and 4 don’t have quite enough red, and neither does row 6. Blue is extra area, so if there’s too much of it, it means the estimate will be a little high. The total I came up with for this example was 2857 square miles. The correct number is probably closer to 2845 or 2840. Still, that’s an error of 0.42% – I’m not fussed.
The second example has only 1 box that doesn’t look quite right, box 3 doesn’t have enough red. So I’d round the area calculated down to 4000 square miles (even though the true area is likely to be more like 3980 sq m) and live with the error of 0.5%.
Of course, if I were doing this in real life, I’d draw two vertical lines, use a ruler to measure the division lengths and mark them on the ruled lines, then draw my box top and bottoms by using the marks. That would also give me the conversion to go from a width measured with the ruler to an accurate box size, so the results would be a lot more accurate – and probably a lot faster..That means that you wouldn’t have the horizontal division marks that the examples show, leaving the map suitable for the next steps.
So, to capital placement. You have to presume that there’s going to be a reason for it – usually a combination of security from the terrain, fresh water supply, and good food capacity close at hand. Just look at where the ancient civilizations had their capitals, and this pattern recurs time and time again.
In the case of Zomania, the example kingdom I offered up in part 1, place I was thinking for the capital is midway between distance markers 100 and 120, where the northeastern road connects with the southeastern road. That’s a short distance from the coast, 10-15 miles or so.
Zomania works out at 14460 sqr miles for the mainland and 1540 sqr miles for the island, a grand total of 16000 square miles. And no, despite that being such a nice, round, number, I did not aim for that result!!
When I say borders in the heading, I don’t mean what the borders are for the Kingdom under discussion; I mean where the borders with each specific other nation end. The average number of borders is with 2.7-2.8 nations. The median is 2 or 3 – disputed territories and other complications make it hard to be precise – but I’m going to go with 3. That means that there are as many countries that have fewer than 3 neighbors as have more. The upper limit is for BIG countries like China and Russia, both of whom have 14 neighbors.
So small countries are likely to have 1-3 neighbors, medium countries 2-4 neighbors, large countries 3-6 neighbors, and very large countries, 4-15 neighbors.
Small = up to Cyprus or Lebanon – around 10,000 square km or smaller (3861 sqr miles).
Medium = 10K – 100K square km (3861-38610 sqr miles) – typical examples would be South Korea and Portugal.
Large = 100K – 1M square km (38610 – 386K sqr miles) – typical examples would be Japan and Germany.
Very Large is anything bigger than 1M square km in size. There’s a long list of these, including Mauritania, Colombia, Bolivia, Ethiopia, South Africa, and Peru, to name just a few.
These would, arguably, be far less common in a Fantasy environment than they are in ours. They are probably Empires, not individual kingdoms, if there is anything that size.
Below, I’ve marked the map of Zomania with the capital and borders with 4 neighbors.
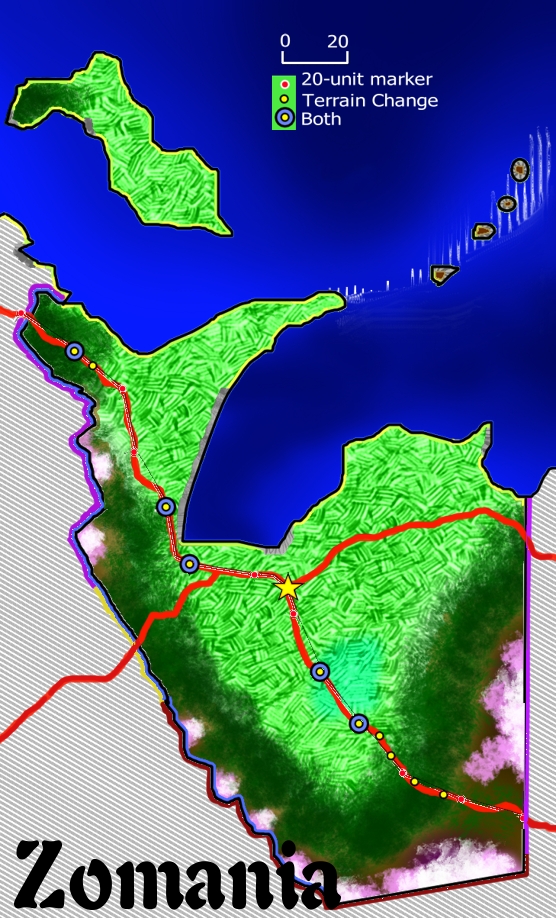
Side-note: Color selection for the borders was a pain, because I had used so many colors in the textured map. I would have had more choices if I had used the outline map shown for the size illustration. It will be useful in the long run, but this is something that you really need to think about from pixel one of making a map, and I didn’t.
So border #1 is at the top in purple. border #2 is hard to see, it’s in yellow, and lies on top of the south-easterly road and the terrain around it. Border #3 is more of a burgundy color, deeper than the red used in the roads, and it goes to the south-eastern corner of the Kingdom and a little beyond. I was strongly tempted to extend it to include the road to the southeast, but – thinking ahead – decided that not doing so would permit me to illustrate a more ‘international’ trade pattern. Then, the last border runs along the eastern edge of the kingdom and encompasses two major roads across the border. The other thing that I thought about was actually splitting this in two, so that I didn’t have two roads into the same neighboring kingdom, but there was nothing to be gained from doing so in this case – because one road into a kingdom was already well served with the purple and yellow borders; two roads into the same kingdom raises questions about efficiency and routing, and I again thought that might be useful later on. If I were generating this Kingdom for actual use in an RPG, I would almost certainly have split the border in two half-way up that eastern edge.
The other thing to discuss before I move on is, where is the tricorner? Where does one border end and the next begin? I’ve always been fascinated by borders and stories of how states and countries got their shapes, and that was heavily on my mind. Let’s briefly run through the options:
▪ Natural Borders – a lot of borders follow rivers and other geographic features.
▪ Climatic differences – because these demand different land use and human habitats, it’s convenient to make them different administrations and cultures.
▪ Parallel to or in line with, existing borders.
▪ Connecting to, or containing, landmarks.
▪ Laziness & Convenience – you see this a lot if you look at what my Pulp Co-GM refers to as “the Ruler States” in the US. These follow lines of latitude or longitude and are entirely artificial – and usually reference one of the other border influences.
▪ Past history – the final ingredient. Kingdoms don’t grow outwards uniformly; it’s a bit here and then a bit there and then a bit somewhere else, meaning that growth tends to create tendrils and blobby protrusions. When the time comes to clean things up and formalize them, if you control the territory on both sides of a geographic feature, it’s easy to draw a line between the outer edges and lay claim to everything in between.
That list, of course, barely scratches the surface. It makes no mention of surveying error – but that’s a key thing in real life. If you look at a map of Australia, the border with Western Australia looks like a straight line:
Map by Richard Russell & Dominic Dwyer, CC0 v 1.0 public domain, via Wikimedia Commons
But when you zoom in on Google Maps to the tricorner, you find this:
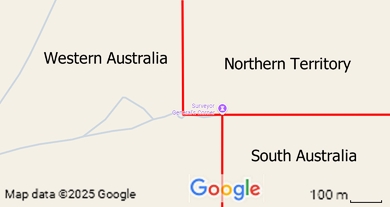
Map derived from Google Maps, edited by Mike; derivative work, copyright remains with Google.
Two teams set off from opposite sides of the continent, one headed north and one south, both on the exact latitude line – or so they thought. The plan was to meet in the middle. When they actually did so, they found that the northern team’s starting point had been about 110m west of where the southern team though it should be. When the Northern Territory was created, about a decade later, the border was run east-west along the same line as the ‘correction point’ where the two teams ‘met’.
This sort of thing goes on all the time in establishing borders, and sometimes leads to conflict and disputed territorial claims. Some compromise is usually reached in the end, but it was not at all uncommon for a grant of land to contain inherent contradictions because of false assumptions. See, for example, Border Irregularities of the United States.
Draw rough outlines of the different terrains on the map. Be fairly discriminating; the concept is that different land use will result from different terrains and that each will have its own challenges, resources, and priorities, which are better handled by making each separate subdomains within the Kingdom. And it helps when doing a breakdown of the different terrains within the Kingdom, something that we’ll do later. Pay particular attention to anywhere that the boundaries between three types of terrain grow close to each other; this is a natural line of division between the two, usually on a north-south or east-west line, but sometimes at 45° from a natural feature.
It’s also time to start thinking about the internal politics, and in particular anywhere that is going to be a natural ground for bandits to hole up because the terrain makes it difficult to police.
On top of that, you don’t want any resource to be the exclusive domain of one administrative sub-region within the Kingdom, because doing so means that any dispute with that administration denies that resource to the Kingdom. Split it two ways and you gain a lot more security from internal threats.
And, on top of that again, and under this heading, cultural, social, and religious clustering – which can lead to other sources of internal conflict in the Kingdom – can demand different administration and sub-domains. When you dig into the early history of the US, this shows up as a strong factor – lots of Germans settle in one part of the country, lots of Greeks in another, Quakers here and Protestants there and what have you. These people want to be administered by someone who accepts their point of view in any conflict that arises, demanding different sub-regional authority.
Past cases of insurrection and rebellion are also a historical factor that applies under this heading.
As with the terrain, is there anywhere where the natural resources are going to demand different priorities of the administration that runs the local area? For example, where there is a coast, there will be a long coastal fringe separating communities that are maritime / fishing in priority from inland, where crop cultivation is the priority.
But this consideration also deals with the historical growth of the Kingdom, as described earlier. While ego and ambition can lead Kingdoms to claim territory that they don’t actually control yet, administrative efficiency is highest when each sub-domain has rough economic parity. That means that surrounding the historic Capital (which, as noted earlier, might not be the contemporary capital). sub-domains will be smaller, older, and wealthier, while those at the fringes will be larger, younger, and (generally), poorer.
I’ve talked about internal threats – this factor deals with external threats, even those posed by supposedly friendly countries. This factor deals with the potential for outside threats. The need for a timely response to any external threats demands separate political sub-domains so that the (hopefully temporary) fall of one does not imperial the entire Kingdom.
Where there are natural barriers to external threat, sub-domains tend to be larger; where there is an open pathway – where roads cross international borders, for example, or a river flows from one country into another, it makes them smaller.
With all this in mind as the forces that shape them, it’s time to carve the Kingdom up into the highest level of sub-domains. The first major decision is how many of them there should be; but I prefer not to look at that; just count them at the end. Instead, thinking about the different factors listed, drawing lines of separation – internal boundaries and borders – defines these areas.
Overall kingdom size is also clearly a factor. A sub-domain is all about the projection of power from the central position to a number of smaller sub-sub-domains, which in turn exert authority and project power over the actual lands.
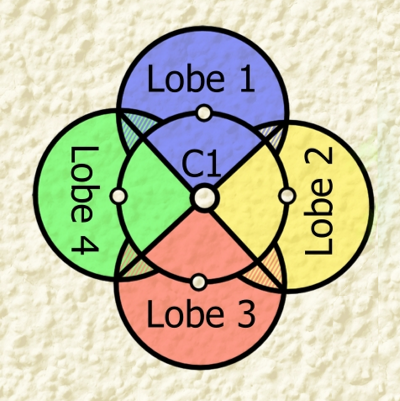
In pure theory, at the limits of power projection for the central zone around C1, this illustrates the way things generally look. This has four lobes of sub-sub-districts, each with a fortification at a range that C1 can reinforce it – and they can all reinforce C1. What’s more, a problem at certain points can be resolved by one lobe with a second proving assistance – there is an overlap.
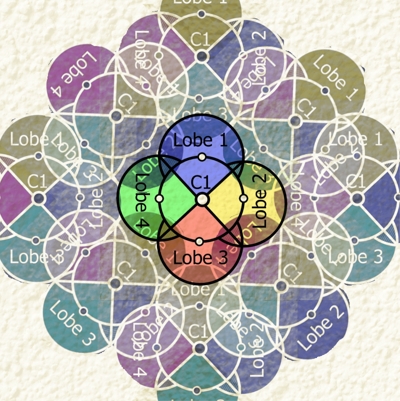
If you think about multiple such zones, you find that there are either gaps that are not well administered – generally, a no-no – or there is a projection of power overlap between C1 and its neighbor. Probably oriented 45° relative to this zone, part of one of its zones would then overlap with both Lobes 1 and 2.
This creates a network in which each interior division of the Kingdom can be reinforced in the event of trouble by its neighbors, who can then be reinforced by their neighbors, and so on – greatly reducing the need for a standing army for defense. If you happen to have such an army, it is therefore freed up for military adventures abroad, conquering new realms for you.
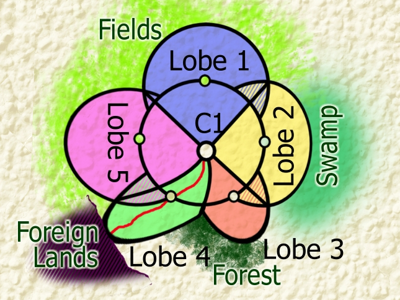
Taking terrain and other such factors into consideration distorts the shape, as can be seen by the second illustration. We now have 5 lobes and not 4, for a start.
Lobe 1 is essentially unchanged.
Lobe 5 is similar in shape but projects further because there’s a road through friendly territory.
Lobe 2 is flattened toward C1 by the presence of swamp; it’s hard to project power through that terrain, you have to go around it.
Lobe 3 projects out into the gap between swamp and forest, but angled along the edge of the forest, indicating that the forest is more economically important than the swamp. It’s also a lot smaller than Lobe 2, indicating that the forest is largely untamed, and so poses a greater threat to C1 than the swamp does.
Lobe 4 is both extended outward and bent by the presence of a road that crosses a border into friendly but potentially hostile territory. Because all the threats are to the South, East, or Southeast, C1 itself has moved a little in those directions to enable it to respond to trouble more expeditiously.
But this is still abstract theory. In reality, lobes are less likely to be round; they could be square, triangular, hexagonal, and all manner of strange and complicated shape, because of all these distortions.
It should also be noted that zones are frequently tugged in both directions at the same time by different influences. The stronger factor will always win out in the end, but be diminished somewhat by the contradictions.
5.7.1.9.2.1 Sidebar: Why do it this way? I’m sure someone is asking that very question at this point. There are lots of answers that will become evident as I use the Zones concept through the course of this chapter, but I thought a higher-level discussion would clarify matters in the meantime.
In response to that question, I invite the reader to contemplate the geography of Egypt. You’ve got the Nile River (densely populated), especially the delta, you’ve got the coast (slightly less densely populated), and you’ve got the desert. Before you can contemplate the total population, let alone the distribution of that population, you need to consider the carrying capacity of the land, i.e. how many people it will support.
Now contemplate a fantasy realm with mountain chains to the east and south. Are these like the alps? Or the Himalayas? What is the carrying capacity? In the regions adjacent to the mountains? “Aha”, you cry, “it depends on the climate!” And so it does – but the overall climate is the same there as in the fertile lowlands. Medieval France, Britain and Germany all had very different carrying capacities – which one does this fantasy Kingdom more closely resemble? Or is it a bit of all three, in different parts – at least in this respect?
You need to subdivide so that you can apply local factors and considerations, locally.
Keeping all that in the back of my mind, as well as the influences mentioned earlier but not taken into account It’s also worth pointing out that, as said, borders often follow natural features, but most of these have not yet been placed on the map; what usually happens is that you place them and then take them into account. What I’m doing here is interpreting that relationship the other way around, using borders to indicate where some of those terrain features are going to be.
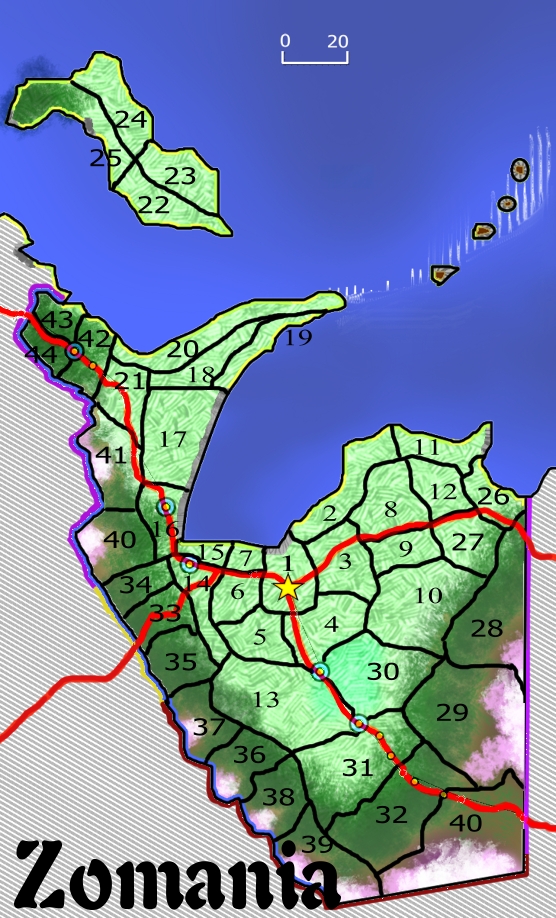
I’ve numbered them in sequence of their capture / conquest – there turned out to be rather more than I was expecting, but that’s okay. If you follow the numbers in sequence, you start to get a feel for the history of the Kingdom, but I won’t go into that yet, it’s not relevant. Analyzing the groupings, sizing, and numbering, it’s clear that the Kingdom is mostly at peace with their Eastern neighbors, somewhat less so to the southwest, and very much less so to the Northwest.
Why would I prefer fewer zones? Because each one has to be appraised and assessed individually. Fewer zones means less work – and faster preparation of these posts.
So, for that reason, I’ve gone back in and merged a number of the zones.
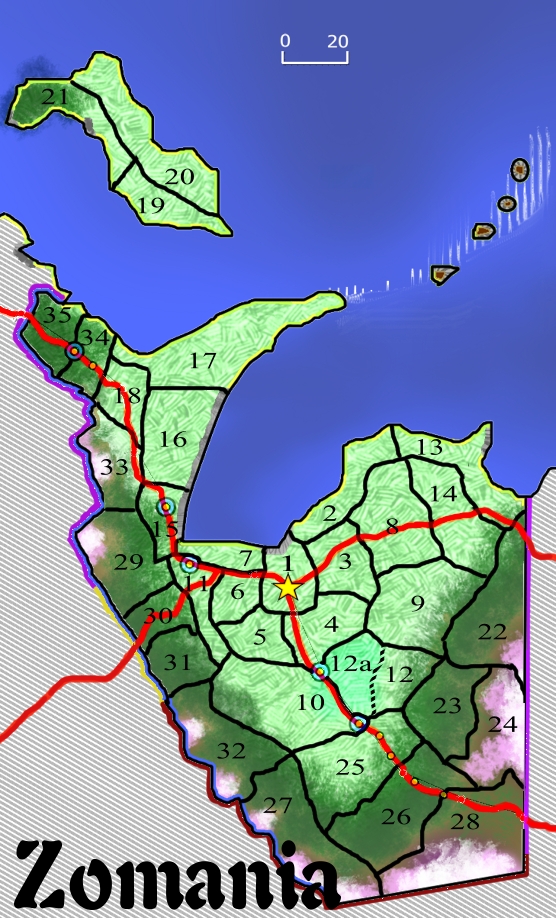
You’ll notice that this consolidation could have gone a LOT further than I have taken it, and that the numbering seems to skip around a bit more in this latest iteration of the map. That’s because of the emerging history of the place.
▪ Initially, it would have been zones 1, 3-6, and half of present-day 2 and 7, all as one domain.
▪ These are then subdivided into the first 7 zones.
▪ Expansion along the coasts leads 2 and 7 to assume their current size and shape.
▪ 8 &9 are added.
▪ 10 & 11 are added.
▪ 12 is added. 12a is initially excluded but is at some point incorporated. The swamp of 12a blocked further expansion from 9 or 10, at least initially.
▪ 13 & 14 are added. This brings Zomania into contact with the Realm to the East.
▪ 15, 16, and 17 are added.
▪ 18 is added.
▪ 19, 20, and then 21 are added, something not possible until new technology in sailing ships becomes available.
▪ 22, 23, 24, and 25 are added. Initially, there would have been another neighbor to the Southeast, but it was half-conquered by the neighbor to the east; the road marks the division between the conquered lands and the residue of that kingdom, now more Southern than Southeasterly.
▪ 26, 27, and 28 are added. Contact with a third neighbor, to the Southwest.
▪ 29, 30, 31, and 32 are claimed. Contact with a fourth neighbor to the West, and a mutual neighbor to that neighbor’s North.
▪ 33 and maybe 34 are added.
▪ the last territorial expansion is into 35, connecting to that neighbor to the Northwest.
Also, if you look closely at 16-18-33, you’ll see that the road makes a sharp diversion around 16. It seems very likely that 16 originally encompassed all three of these zones, but that they were lost in a war with one of the neighbors and later regained.
Once you have your list of zones, go through and for each one, rank the current threat to which it is exposed out of 5. If there was a historical threat that has since been resolved, rank that and divide by 2 before adding that to the current threat level. The capital city always adds 1; a former capital (if there is one) adds 1/2. In addition, for each past war, add 1/2 to whichever capital then held sway.
To get these, I’ve assigned threat levels to each of the neighboring Kingdoms and also to the Swamp. Forests are a little more dangerous than plains, mountains are more dangerous again.
▪ Zone 1: Current 2 + capital 1 + past wars 5/2 = 3 + 2.5 = 5.5
▪ Zones 2 & 7: Current 2
▪ Zones 3, 5, & 6: Current 1
▪ Zone 4: Current 2 + past 4/2 = 2 + 2 = 4
▪ Zone 8: Current 1
▪ Zone 9: Current 1 + past 3 /2 = 2.5
▪ Zone 10: Current 2 + past 4/2 = 2 + 2 = 4
▪ Zone 11: Current 1 + past 2/2 = 1 + 1 = 2
▪ Zone 12: Current 2 + past 5/2 = 2 + 2.5 = 4.5
▪ Zones 13 & 14: Current 1 + Past 2/2 = 1 + 1 = 2
▪ Zones 15 & 16: Current 1 + Past 1/2 = 1 + 0.5 = 1.5
▪ Zone 17: Current 1 + Past 2/2 = 1 + 1 = 2
▪ Zone 18: Current 1 + Past 3/2 = 1 + 1.5 = 2.5
▪ Zone 19: Current 1 + Past 3/2 = 1 + 1.5 = 2.5
▪ Zone 20: Current 1 + Past 4/2 = 1 + 2 = 3
▪ Zone 21: Current 2 + Past 4/2 = 2 + 2 = 4
▪ Zones 22 & 23: Current 2 + Past 2/2 = 2 + 1 = 3
▪ Zone 24: Current 3 + Past 2/2 = 3 + 1 = 4
▪ Zone 25: Current 2 + Past 1/2 = 2 + 0.5 = 2.5
▪ Zone 26: Current 3 + Past 4/2 = 3 + 2 = 5
▪ Zone 27: Current 4 + Past 4/2 = 4 + 2 = 6
▪ Zone 28: Current 3 + Past 4/2 = 3 + 2 = 5
▪ Zone 30: Current 2 + Past 5/2 = 2 + 2.5 = 4.5
▪ Zone 29: Current 2.5 + Past 4/2 = 2.5 + 2 = 4.5
▪ Zone 31: Current 2 + Past 4/2 = 2 + 2 = 4
▪ Zone 32: Current 3 + Past 3/2 = 3 + 1.5 = 4.5
▪ Zone 33: Current 3 + Past 4/2 = 3 + 2=5
▪ Zone 34: Current 3 + Past 4/2 = 3 + 2=5
▪ Zone 35: Current 3 + Past 5/2 = 3 + 2.5 = 5.5
The final step is to total the Current and Overall threat ratings:
▪ Current: Zones 1-7: 3 + 2 + 2 + 1 + 1 + 1 + 2 = 12
▪ Current: Zones 8-12: 1 + 1 + 2 + 1 + 2 = 7
▪ Current: Zones 13-21: 1 + 1 + 1 + 1 + 1 + 1 + 1 + 1 + 2 = 10
▪ Current: Zones 22-27: 2 + 2 + 3 + 2 + 3 + 4 = 16
▪ Current: Zones 28-35: 3 + 2 + 2.5 + 2 + 3 + 3 + 3 + 3 = 21.5
▪ Grand Total, Current: 12 + 7 + 10 + 16 + 21.5 = 66.5
▪ Overall: Zones 1-7: 5.5 + 2 + 2 + 1 + 1 + 1 + 4 = 16.5
▪ Overall: Zones 8-12: 1 + 2.5 + 4 + 2 + 4.5 = 14
▪ Overall: Zones 13-21: 2 + 2 + 1.5 + 1.5 + 2 + 2.5 + 2.5 + 3 + 4 = 21
▪ Overall: Zones 22-27: 3 + 3 + 4 + 2.5 + 5 + 6 = 23.5
▪ Overall: Zones 28-35: 5 + 4.5 + 4.5 + 4 + 4.5 + 5 + 5 + 5.5 = 38
▪ Grand Total, Overall: 16.5 + 14 + 21 + 23.5 + 38 = 113
I’ll be using these values a little further down the track.
But we need to adjust the totals for size – I could have broken Zomania into 3 or 5 zones instead of 35, and the total of the ratings would be completely different.
16000 square miles / 35 zones = 457.143 square miles to a Zone, on average. But look back to the initial diagram showing the four lobes: if I give each of the circles a radius of one, then we have a square of 2 × 2 and four semicircles of radius 1, a total area of 23.74 units – where each unit is defined as the distance an army can project power from a fixed position. And that was calculated as 2.593 days for infantry and 4.5 days for cavalry back in 5.7.1.2.
Cavalry are so much more expensive in every respect that you would never use them as your primary military resource. So a unit area is going to be [3×6 (for 3 miles per hour) / 24]^2 × 2.593 = 1.46 square miles. We have 23.74 of these in a basic control zone, so 34.66 square miles. Multiply by the normal rating maximum of 5 and we get 173.3 square miles in a standard Zone.
Our totals have to be adjusted by a factor of Average Zone Size / 173.3.
▪ Adjusted Grand Total, Current: 66.5 × 457.143 / 173.3 = 175.4
▪ Adjusted Grand Total, Overall: 113 × 457.143 / 173.3 = 298
But not so fast: We also have to adjust for the overall military strength, relative to an average of 2.5. I’m going to select the third example from 5.7.1.1.3 as indicative of Zomania – that was an overall military strength of 3.5, and an adjusted strength of 5.8.
▪ Adjusted Grand Total, Current: 175.4 × 5.8 / 2.5 = 407
▪ Adjusted Grand Total, Overall: 298 × 5.8 / 2.5 = 691
Wealth isn’t just about what resources a Kingdom produces, it’s about what it can hold onto. The more wealth it has, the better the defenses that it can build, and the more wealth it will gradually accrue – so wealth can be be viewed as an investment in military strength.
You can actually think of a Kingdom’s economy in terms of a self-employed person’s household. You have so much income coming in, and have to expend that on various things to keep the household productive, safe, and happy – in that order.
▪ Productive covers administration, tools, transportation, resource development, trade, and education.
▪ Safe covers military, justice, food, housing, and diplomacy. In a fantasy campaign, it can also cover magic and religion.
▪ Happy covers entertainment, luxuries, and social mobility, as well as savings for rainy days and other disaster relief.
That’s 16 subcategories, but they aren’t necessarily equal in terms of the demands placed upon the public purse. Administration is generally cheap so long as enough is spent on ‘Happy’. Tools include things like fishing fleets. Transportation is mostly roads but also includes food & resource distribution. Resource Development not only includes opening up new sources of wealth like mines, but also obtaining the grain for next year’s crops and tax collection. Wouldn’t it be nice if you could afford everything?
Well, you can’t. Because if you could, then you would be seen as a glittering prize worth capturing, which ramps up the threat level, and demands additional military spending, and before you know it, you’re back in break-even territory. Military infrastructure in particular is expensive to maintain and incredibly expensive to construct. Military units drain available manpower for other essentials.
Trying to represent all of this into something workable can be a nightmare, and is generally so full of ad-hoc assumptions that it’s not worth a whole lot, anyway. The solution is to generalize and abstract, and then leave specific interpretations up to the needs of the moment.
Below, I’ve ranked each of the categories on a scale of 1-4, representing how much of the public purse they generally represent, and then multiplied the square of those ratings by 10 for reasons that will become clear in a little bit.
▪ Administration 10
▪ Tools 90
▪ Transportation 90
▪ Resource development 90
▪ Trade 40
▪ Education 40
▪ Military X
▪ Justice 90
▪ Food 160
▪ Housing 160
▪ Diplomacy 10
▪ Magic 90
▪ Religion 160
▪ Entertainment 40
▪ Luxuries 10
▪ Social mobility 40
▪ Savings & Disaster Relief 90
You may have noticed Military = “X” – simply drop in the Overall rating from the previous section. In the case of Zomania, that would be 691. And then add whatever you think appropriate in terms of military expansion and training – because that only pays for what you’ve already got. That might be +10%, +20%, +25%, +30%, +40%, or even +50% – but it’s most likely going to be one of the middle values, +25% or +30%. I’ll choose + 25% and set the military budget to a relative value of 864 points.
If you add all of these up, you get a total of 2074 points – out of a budget of how much?
That’s up to you. Below, I have provided a deliberately biased, asymmetric, and non-linear random table, but I would discourage it’s use. Instead, you should be thinking about the consequences and ramifications of cutting or increasing different elements of the budget and the impacts on national character and government style and making a deliberate choice that describes the Kingdom that you see in your head.
The one thing that a single glance at the table should tell you is that there is NEVER enough money to do everything you want in the most idealized and perfect way possible. Trimming ‘the fat” from any of the line items listed above has real impacts on the culture and society, sending ripples and shockwaves up and down the connective tissues that hold it all together.

d%
01-02 = 500 + 10 × d20
03-05 = 600 + 10 × 2d6
06-10 = 700 + 10 × d12
11-12 = 725 + 10 × d10
13-17 = 750 + 10 × d8
18-20 = 775 + 10 × d6
21-25 = 800 + 8 × d20
26-29 = 825 + 8 × 2d6
26-34 = 850 + 8 × d12
35-39 = 875 + 8 × d10
40-44 = 900 + 6 × d20
45-48 = 930 + 6 × 2d6
49-52 = 970 + 6 × d12
53-56 = 1000 + 5 × d20
57-71 = 1020 + 5 × 2d6
72-76 = 1050 + 5 × d12
77-81 = 1080 + 5 × d10
82-85 = 1100 + 5 × d8
86-89 = 1150 + 5 × d6
90-92 = 1200 + 4 × d12
93-95 = 1250 + 4 × d10
96-97 = 1300 + 2 × d20
98-99 = 1400 + 2 × d10
00 = 1500 + d20 + 2d6 – d12
Cutting the budget in any area by 40% still permits that area to operate at 80% effectiveness. Repeat as necessary:
60% budget = 80% effectiveness
60% × 60% = 36% budget = 80% × 80% = 64% effectiveness
60% × 36% = 22% budget = 80% × 64% = 51% effectiveness
60% × 22% = 13% budget = 80% × 51% = 40% effectiveness
60% × 13% = 8% budget = 80% × 40% = 32% effectiveness
60% × 8% = 5% budget = 80% × 32% = 26% effectiveness
60% × 5% = 3% budget = 80% × 26% = 21% effectiveness
But the reality is that you’re going to have to trim the military budget and then use these cost-cutting measures to tidy up in the corners as it were.
Let’s say that Zomania is doing fairly well, and has a budget of 1050 + 5 × d12, which – when rolled – comes out to 1100 budgetary points.
1. Eliminate the upkeep of legacy defensive structures that are no longer needed. Right away, that cuts the budget by the amplified difference between current and overall:
864 – (407 + 25%) = 864 – 509 = 355. Our budget of 2074 shrinks to 1719.
Consequences: old infrastructure falls into decay and ruin. Some of it can be protected from this by basing other administrative functions from the existing structures, and some of it will naturally survive because a subordinate local can call it ‘home’ and cover the upkeep out of his own household budget. Some of what’s left can be recouped by selling it to wealthy individuals – binding them to the crown with the addition of noble titles and a few minor privileges and the potential to increase that rank through service. And one or two can be turned into Museums, letting part of the education budget do double-duty.
This repurposes 20% of the administration (10), Justice (90), Education (40) and Social Mobility (40) budgets – salvaging 36 points of the 355, and probably boosting income by a like amount so 72 out of 355. That still leaves 80% of them becoming abandoned ruins and “dungeons” in the D&D meaning of the term.
Spending = 1719, Income = 1136. Deficit = 583.
Let’s cut the military training in half – instead of fully-funding it, Officers being promoted now have to pay half the costs themselves. Again, 20% of the social mobility budget can be dedicated to scholarships to take the edge off those cuts.
Fully-funded, that was 509-407=102; so that saves us 61, cutting spending to 1658, and increasing income by 80% of this cut = 49 + 1136 = 1185.
Spending = 1658. Income = 1185, deficit = 473.
But now it gets more difficult. The Savings & Disaster Relief funds are dead money – instead of the state funding this, let’s simply have the state deal with the immediate problems and promote citizens-helping-citizens in time of need. 3% of the existing allocation of 90 points still gets us 21% effectiveness, and saves 87 points, cutting spending to 1571.
Spending = 1571. Income = 1185. Deficit = 386.
Religion doesn’t need to be fully state-funded. It can earn money through donations and fees for services. The state only really needs to fund certain events like coronations, state funerals, and royal births. So let’s carve out 92% of that budget, taking it from 160 down to 13, a savings of 147, reducing spending to 1424. This has the effect of making the church an independent force within society – we could tax the donations that we expect them to take in to make up for this deficit, but that would put them off-side.
Maybe simply taxing income earned for services, which would be about 60% of the savings, and at a relatively low 10% rate, under the guise of ‘social equality’. That’s additional income of 10% × 60% × 147 = 9, a total now of 1194.
Spending = 1424. Income = 1194. Deficit = 230.
Magic, again, doesn’t need to be fully state-funded. Let’s cut 64% out of that budget of 90, reducing our spending by 58. We can replace some of this from the Social Mobility budget in the form of subsidized apprenticeships – another 20% of that budget can be turned to the task – in return for the occasional service to the crown. So spending is reduced to 1366, but the actual effectiveness is going to be closer to the 80% mark than the base 64%.
Spending = 1366, Income = 1194. Deficit = 172.
The biggest untouched cost areas are Housing and Food, but most rulers will be loathe to cut that budget, say by instituting some sort of annual property tax. That’s the sort of thing that stirs resentments and fosters rebellions.
Instead, let’s look at Tools. Cut the funding to a mere 22% of the current 90, but make the savings available as loans to be repaid as an additional tax. Sure, one in ten won’t be able to make the repayments, but they can sell their tools to someone who thinks they can do better, starting the cycle over again.
Savings of 70, and income goes up by 63.
Spending = 1296, Income = 1257. Deficit = 39.
Entertainment for the masses doesn’t have to be fully subsidized, but we don’t want to cut the spending by much lest we put this social safety valve out of reach of the public. Let’s cut 20% of the budget and recoup the losses by charging admission – distributed over vast numbers, that’s likely to be a trivial expense, and we can even enhance the perception of a fair deal by sloughing any excess into subsidized foot and drink at the venues. So that’s a reduction in spending of 8 and an increase in income of 8.
Spending = 1288, Income = 1265. Deficit = 23.
Let’s slow resource development just a touch – 20% of 90 saved. Let’s further stipulate that if a private party is willing to pony up the full value of a resource, they can buy it from the government after a set period of time – ten or twenty years. In the short term, that will put the squeeze on the budget, but in the long run, it will move this expense off government hands by generating additional income to cover 80% of the costs. If this scheme was enacted a long time ago, that would cut the government’s contribution to just 20% or so, with income rising by the difference.
So that’s 18 saved, and additional income of 72 – eventually.
Spending = 1270, Income = 1265 (eventually, 1337). Deficit: currently 5, rising to a surplus in 10-20 years of 67.
A deficit of 5? That’s easily made up – borrow from someone, even at 100% interest, and in a couple of years all is well.
You’ll notice that Zomania is a fairly wealthy kingdom; it didn’t have to make deep cuts on any of the services that it really didn’t want to touch. Housing, and road maintenance (Transport), and so on. Nor did it really have to do much to Education, or Justice, or Diplomacy, or Social Mobility. And they did nothing to monkey with Food or Trade. And – most of all – the didn’t have to impose excessive taxes.
Housing: 160 Transport 90 Education 40 Justice 90 Diplomacy 10 Social Mobility 40 Food 160 Trade 40. Add those up and you have 630 points more-or-less untouched.
So, just so that I get to talk about those items, let’s impose a natural disaster that wipes, say, 400 points out of the budget, at least for a while. A War would do that, or a famine, or a pestilence – the usual things. Or even a milder combination of all of them coming at once.
Spending = 1270. Income = 1337-400=937. Deficit = 333.
Housing. The government institutes a property tax or starts charging rents roughly equal to 60% its costs, and starts turning paupers out into the streets. To soften the blow, it ploughs 10% of the savings into increased Social Mobility. We don’t have a metric for 40% of budget, the closest we have is 36%, so we’ll use that.
36% of 160 is 35, a savings of 125. Increased social mobility spending is 10% of that, or 12 points – which is a more than 25% increase on the allocated budget in that area. To get the effectiveness of increased spending:
+ 67% of budget = + 25% (i.e. 125%) effectiveness.
+ 111% of budget (i.e. 278%)= + 31% (i.e. 156%) effectiveness
+ 185% of budget (i.e. 463%)= + 39% (i.e. 195%) effectiveness
+ 309% of budget (i.e. 772%) = + 49% (i.e. 244%) effectiveness
Fractions are proportional within the band. So raising the social mobility budget from 40 to 52 = 130% budget; 130/167 = 0.78; so that produces 78% of + 25% or + 20% effectiveness. So this would also raise income by + 20% of the 12, or 2.
Spending 1270-125 + 12 = 1157. Income 937 + 125 + 2=1064. Deficit = 93.
Cutting into the food budget creates a new category of spending – health – which until now has been subsumed by the Religious budget because Clerics can do healing. So there isn’t a lot that can be done here. Whatever you save on the food budget gets eaten up by the health budget – if both are to operate at 100% efficiency.
But if there’s a gap? There are some small savings possible.
60% of the food budget is 96, a savings of 64. Results: food is only 80% of what’s needed for health.
New budget item with a base value of 64: Health. 60% of 64 is 80% effective at bridging that 20% health gap so 96% healthy populace for a savings of 26. But income will also fall to 96% of what it was, a loss of 43. So this is actually cutting off your nose to spite your face. To be effective at saving money, the cuts would have to go a lot deeper.
So let’s leave food alone.
Spending 1157, Income 1064, Deficit still 93.
If the big loss of income was due to war, increasing the diplomacy budget might not be a bad idea. It’s a relatively small increase in costs for a potentially big dividend in security. Instead of a paltry 10, let’s whack it up to 40. That’s 400% of budget.
278% of that gets us to 156% effectiveness, and leaves 122% further increase. 122%/185% = 0.66, so that gets us 2/3 of the additional + 39, or + 26% effectiveness. So for 30 additional spending, our diplomats become 156 + 26=182% effective.
Spending rises of course. But there is an upside: Increased diplomatic success increases trade deals, which in turn increases income. Right now, Trade is a 40-unit item; 182% of 40 is 74; so that’s + 34 in direct income.
Spending 1157 + 30 = 1187; Income 1064 + 34=1098; Deficit = 89.
Buoyed by the success of this measure, the Kingdom decides to further boost the Trade budget, from it’s current 40-for-74-worth to 200. That’s a BIG investment – but it leverages the diplomatic gains for a win-win, economically. 200-40 = 160; 160/40=4; so this is a + 400% increase in the budget for this area, to a total of 500%.
463% of this gets us to 195% effectiveness, and leaves 37. 37/309 = 0.12; 0.12 × 49 = 6; so the total is 201%. But then we apply the diplomacy bonus, × 1.82, and get 365.82% effectiveness over the 40-unit base. 365.82% × 40 = 146, an increase of 106.
So we’re spending 160 more and getting an income increase of 106. Whoops.
The principle that the decision-makers in this hypothetical situation have failed to take into account is that of diminishing returns. Small increases – or decreases – give you more bang for your buck, as it were.
So, instead of this great splurge on trade, let’s drop it back to a more sedate + 67% of budget. That gets + 25% effectiveness. 1.67 × 40 = 67, a + 27 spend. It nets us 1.25 × 40 × 1.82 = 91 income, an increase of 51 – of which, we were already getting 34 from the diplomacy alone.
Nevertheless, that’s far more effective, in budgetary terms.
And it’s buoyed further by a second principle which has not yet been taken into account: residual benefits. A big splurge on trade ONCE doesn’t just increase income for the year in which it happens (or the following year, depending on the timing and economic mechanics within the Kingdom) – it generates it for × years and then tapers off at a rate of Y% per year.
As a general rule, × is going to be 3, 5, or 10 years; and Y is going to be somewhere between 20 and 50%.
To get the net impact overall, you have to add up the increases over the entire period and divide by the period to get an average annual impact.
The more that you initially invest, the higher × should be, and the lower Y.
So let’s examine the two choices offered and see where we end up.
The big spend: 10 years, 30% decay, base 91.
91 × 10 + 0.7 × 91 + 0.7^2 × 91 + 0.7^3 × 91 and so on.
0.7 ^ n × 91 = 1 tells us how long the residual benefits last.
n × log 0.7 = log 1/91
-0.155 n = -1.96
0.155 n = 1.96
n = 1.96 / 0.155 = 12-point-something years.
91 × 10=910
(1) 0.7 × 91 = 64
(2) 0.7 × 64 = 45
(3) 0.7 × 45 = 32
(4) 0.7 × 32 = 22
(5) 0.7 × 22 = 15
(6) 0.7 × 15 = 11
(7) 0.7 × 11 = 8
(8) 0.7 × 8 = 6
(9) 0.7 × 6 = 4
(10) 0.7 × 4 = 3
(11) 0.7 × 3 = 2
(12) 0.7 × 2 = 1
Total over 22 years = 1123. Overall yield = 51 per year.
Similarly, the increase in costs are spread over the same period: 160 / 22 = 7-point something, so it will sometimes be 8 and sometimes 7. That’s a net increase in income overall of 43 a year.
The small spend: 3 years, 50% decay, base 51.
0.5 ^ n × 51 = 1
0.5 ^ n = 1 /51
n × log 0.5 = log (1/51)
-0.30103 n = -1.7076
n = 5.6 so 5 years.
51 × 3=153
(1) 0.5 × 51 = 26
(2) 0.5 × 26 = 13
(3) 0.5 × 13 = 6
(4) 0.5 × 6 = 3
(5) 0.5 × 3 = 1
Total over 8 years = 202. Overall yield = 25.25, so 25 most years, occasionally 26.
Cost: 27 / 8 = 3.375, so usually 3, occasionally 4 (but 4 more often than the 26 occurs).
Net effect: 3 spent for 25 return.
Both choices are thus shown to be viable. But we’re currently running a deficit of 89, and the bigger outlay yields a number better than that, so that’s the better choice under these circumstances.
Spending: 1187 + 7=1194; Income 1098 + 51 = 1149. Deficit = 45.
Cuts to Education will yield reduced income in a generation and other negative consequences. We really don’t want to mess with it too severely. But a brief, small, cut in the budget may be something that can be coped with. If the underlying economy is good (which it is for Zomania), this becomes less disastrous.
The severity of the impact depends on the number of years of formal education being provided by the government. If it’s 10 (unlikely) then a 1-year cut will impact 10% of current students, a 3-year cut, 30%, and so on. Balancing this in terms of economic impact are the students who are not affected, being educated either before or after the cuts. The average productive lifespan outside of education is the base for measuring the economic impact – 30 years is a reasonable average number. A 1-year cut affects 10% of current students who are 10 in 40 of the economy – so that’s 10% × 10 / 40 = 2.5% economic cost.
If the average schooling is only 5 years (still high for a medieval period), that adds another 5 years to the productive life (assuming unchanged average lifespans) so a 1-year cut would be 20% × 5 / 40 = 0.025% economic loss.
We could cut Education completely out of the budget, and let the citizens learn from other citizens – but the social consequences would be horrendous. Literacy and the upward mobility of skills and talent would be decimated. Churches would be only too happy to step into the breach – with indoctrination in their wake.
Education is only a 40-point item. Even this extreme action would not balance the books.
Rather than general cuts, mandating a series of milestones at which a certain level of ability must be demonstrated before further education is permitted / required would permit selective cuts – in effect, putting the most poorly-performing students out on the street to earn a living as best they can. But this adds a requirement for some sort of standardized testing, if it is to be fair, which is an additional expense. The more checkpoints you have, the greater this expense.
Savings come from the number of students who aren’t being educated, as a result, and there is some offset from them being economically productive for a longer period.
The maths can get quite convoluted, but precision isn’t all that necessary; we can use the general effectiveness model and just interpret the consequences.
Forget being fair – it costs too much. Instead, let’s cut the budget for education by 40% and set a base scholastic level of 3 years, with an additional 2 for the best, and higher education only for the best of the best, provided through the Social Mobility budget as scholarships.
That saves us 16, offset by 20% × 16 = 3, and an economic cost of 20% × 40 / 5 of 0.025% – a loss of income of 1149 × 0.025% = 0.2875 units – more than covered by rounding errors.
Spending: 1194-16=1178; Income 1149 + 3 = 1152. Deficit = 26.
Roads don’t decay overnight. We can accept a temporary decrease in road maintenance if we later boost it so that we end up more or less at 100%.
How long is a better question – earthen roads deteriorate more quickly but are cheaper to repair, and aren’t used for vital transport. Better roads deteriorate more slowly but are more expensive to repair and are used for vital transport.
If the fundamentals of the economy are good – as is the case with Zomania – the better answer is the backroads and cart-trails. If the fundamentals are more shaky, the better roads give you more leeway to recover.
The Transportation budget is currently 90. As a general rule, expense × quality = 1 – so the roads better than the median quality cost as much as roads that are worse.
We need 26 to balance the budget, and are running out of places to find it. 26 is 29% of 90. So we could cut the budget for maintaining the 29% least-used roads in the Kingdom completely and balance the budget. Or we could cut it to 60% (keeping 80% effectiveness) and cut the next-most-used 29% of roads by however much more we need.
60% × 29% × 90 = 16, and we would normally spend 26 on those roads of our 90 budget, so that’s 10 saved. We need another 16.
We can save another 10 on the next 29%.
We could save another 10 on the third-tier roads, but we don’t need that much – saving 6 is enough.
6 / 26 = 21%. So we’re talking 89% of budget for this third tier of roads. If 40% reduction in budget yields 20% loss in effectiveness, then 21% reduction yields 11% loss in effectiveness. So these roads will be permitted to deteriorate to 89% condition.
Now, we want to schedule the counter-balancing increase. 10 saved on the bottom 29% means 16/26 spent, or 0.615. The reciprocal of that is 1.625, and 1.625 × 26 = 42, so saving 10 now means spending 42-26=16 later.
The same for the second tier. While these will be better-quality roads, making them more expensive to repair, they will deteriorate less, so it all evens out.
The third tier we aren’t affecting as badly – 89% condition. 1 / 0.89 = 1.1236, and 1.1236 × 26 = 29.2, so 3 extra needed.
Total: we will have to spend 16 + 16 + 3=35 extra on roads, eventually.
Those are values per year. So if we stint on the maintenance for 3 years, that’s 35 × 3=105 that we have to spend, eventually.
We also have to think about how quickly roads decay.
▪ Earthen tracks and trails will last about 5 years without maintenance, maybe 10 if they are used regularly.
▪ Add some gravel or cobbles and you double the lifespan to 10-20 years.
▪ Add a binding agent of some kind, like tar, and you double that again, to 20-40 years.
▪ Clay-fired bricks are roughly the same.
▪ Concrete and high-quality asphalt increase that by about 25%, to 25-50 years.
▪ Pneumatic Tires (yes, I know Americans spell it Tires) add another 25% to the Clay-fired brick value (30-60 years).
That doesn’t mean that the road is completely gone. It means that there are damaged sections. This decay doesn’t start until the minimum period has passed – so 3 years of non-maintenance of even a dirt track doesn’t have a serious impact.
▪ Earthen tracks 50-100% + 10%/year.
▪ Add some gravel or cobbles 25-50% + 8%/year.
▪ Add a binding agent of some kind, like tar: 10-20% + 5% / year.
▪ Clay-fired bricks: 7-15% + 3% / year.
▪ Concrete and high-quality asphalt: 5-10% + 2% / year.
▪ Pneumatic Tires: halve decay for everything better than gravel roads.
The significance of the road, multiplied by the decay level, gives the economic impact.
An earthen track – the bottom 10% of roads, and therefore the least significant roads – isn’t maintained for 5 years. Roll d6 and add 4 to get a range of 5-10: I get 8. So there is no measurable impact for 8 years. At the end of that time, roll 10 × d6 + 4 to get 50-100 – I get 60%. So if there’s an economy of 1150, 10% of that is 115, and that’s reduced by 60% to 46, so the economic impact is 115-46=64 points.
If there’s an alternative route that is less than twice as long, this impact can be halved. 23 points.
If your road maintenance is 80% effective, divide or multiply everything by 0.8 – so 8 years becomes 10 years, 60% × 0.8 = 48% damage, 115 economic significance drops by 48% × 115 = 55, so the economic cost is 115-55 = 60 points.
There are Roman-built roads that you can drive on to this day, 2000-odd years later. Presumably, they’ve had some maintenance over the years, but still…
Both increased spending and an increased budget act to increase the level of viable population. There is a delay while you wait for the children to mature (and survive) but that’s too complicated.
Divide each of these results by 1000 and multiply them together. Jot the results down as the Economic Population Factor.
In the case of Zomania, ignoring the hypothetical disaster, we had 1270 / 1000 and 1337 / 1000, or 1.69799. Call it 1.7 for convenience. That’s the proportionate increase in population density that the economy supports.
I was able to balance the Zomania budget, even under the hypothetical scenario offered, without encroaching on the military strength of the Kingdom. That’s because the cut was calculated to give scope to demonstrate various elements of the budget and how it assists worldbuilding.
That means that I need a new theoretical scenario in order to demonstrate the cutting of the military budget – always one of the last resorts of the ruling class, but sometimes you have no choice.
Let’s say that the war, costing 400 treasury units, was actually a foreign venture – the equivalent of England invading France – and that, as military ventures go, it was a total disaster. Half the attacking force was wiped out, and the rest limped home.
Instead of 691 points, the military strength of Zomania has been (temporarily) cut to 345 points.
The first thing to do is to compare the losses with the budget for military expansion, because that indicates how quickly the military can be rebuilt. We were budgeting to take the military from 691 to 864, an increase of 173 points. Following a disastrous campaign, we can expect 25% of the survivors to retire as soon as they can, so we not only need to replace 345 points, we need to also replace another 1/4 of that, another 88 points, or a total of 433 points.
433 / 173 = 2.503. So that’s 2 1/2 years.
There are three ways of distributing the losses.
▪ You can distribute them evenly throughout.
▪ You can keep the most important units mostly intact and deepen the losses in the areas under less threat.
▪ Or, you can cut the central command and training centers to the bone, on the basis that these losses will be easiest to replace, and trim any additional losses as per the second option.
Ultimately, these are just guidelines. Budgets will be adjusted in each zone individually. The total of the current values was 66.5; so multiplying (4 – each current zone’s rating) by 433 / 66.5 = 6.5 would distribute the losses with a weighting for military need. From there, we can tweak further – probably halving the losses in rating 3 zones, and then working out the shortfall by further cutting from zone 1.
▪ Zone 1: Current 2 + capital 1 = 3; 4-3=1; 1 × 6.5 = 6.5, round to 6. Halve to 3.
▪ Zones 2 & 7: Current 2; 4-2=2; 2 × 6.5 = 13.
▪ Zones 3, 5, & 6: Current 1; 4-1=3; 3 × 6.5=19.5, round to 20.
▪ Zone 4: Current 2; 13, as above.
▪ Zone 8: Current 1; 20 as above.
▪ Zone 9: Current 1; 20 as above.
▪ Zone 10: Current 2; 13 as above.
▪ Zone 11: Current 1; 20 as above.
▪ Zone 12: Current 2; 13 as above.
▪ Zones 13 & 14: Current 1; 20 as above.
▪ Zones 15 & 16: Current 1; 20 as above.
▪ Zone 17: Current 1; 20 as above.
▪ Zone 18: Current 1; 20 as above.
▪ Zone 19: Current 1; 20 as above.
▪ Zone 20: Current 1; 20 as above.
▪ Zone 21: Current 2; 13 as above.
▪ Zones 22 & 23: Current 2; 13 as above.
▪ Zone 24: Current 3; 3 as above.
▪ Zone 25: Current 2; 13 as above.
▪ Zone 26: Current 3; 3 as above.
▪ Zone 27: Current 4; 4-4=0; no reduction.
▪ Zone 28: Current 3; 3 as above.
▪ Zone 30: Current 2; 13 as above.
▪ Zone 29: Current 2.5; 4-2.5=1.5; 1.5 × 6.5 = 9.75; round to 10.
▪ Zone 31: Current 2; 13 as above.
▪ Zone 32: Current 3; 3 as above.
▪ Zone 33: Current 3; 3 as above.
▪ Zone 34: Current 3; 3 as above.
▪ Zone 35: Current 3; 3 as above.
Adding those reductions up:
▪ 3 + 13 × 3 + 20 × 3 = 102;
▪ 20 × 3 + 13 × 2 = 86;
▪ 20 × 6 + 13 = 133;
▪ 3 × 2 + 13 × 3 + 0 = 45;
▪ 3 × 5 + 13 × 2 + 10 = 51.
▪ 102 + 86 + 133 + 45 + 51 = 417. Required: 433. Difference: another 16 needed.
There are 12 zones currently rated 1, losing 20 each; increasing those losses to 21 leaves 4 more to find. In this case, having limited the losses, I would increase the 10 to a 12-point loss and the 0 to a 2, so that no zones were completely untouched.
Note that this would not be the result of combat alone; the 4-rated zone would have borne it’s fair share of the losses. This outcome also reflects a redistribution of men from the secure 1-rated zones to where they are more urgently needed. If it was only for a few months, they might leave their families in place; but for 2 + years, probably not.
Fortunately for the citizens of Zomania, this is a theoretical exercise, and we can now return to a situation in which they are strongly defended and relatively wealthy.
But that will have to wait until next time. This post has grown so large that I’ve made the decision to cut it in two, letting the economic technique of world building feature, and getting into the purpose of it and what it’s used for in the next one.
You can look at this in either of two ways; Either I’m giving you 17,800-odd words less than I’ve already written (the negative perspective) or I’m already 17,800-odd words ahead when it comes to getting the next one done.
Add to that the
3950 diagrams that are hopefully worth at least 500 words apiece and you can see that the next part of this chapter is well on its way!

Discover more from Campaign Mastery
Subscribe to get the latest posts sent to your email.


September 6th, 2025 at 7:19 pm
Reading about land transport in this chapter really made me think about how essential movement and connection are in shaping trade. Without carts, animals, and early roads, goods would have stayed locked in one place. I like how the text highlights not just the practical side of transport, but also the way it opened doors for communities to grow, share, and survive together. It reminds me that even simple systems of travel can have a huge impact on the way societies evolve.
September 30th, 2025 at 8:45 pm
I like how this chapter shows that transport wasn’t just about moving goods—it was about connecting people and building communities. Even simple forms of land travel laid the foundation for trade, cooperation, and growth in society. It really highlights how movement shaped human progress.
October 1st, 2025 at 3:37 am
Humans travelled for practical purposes all the time, but in the process, spread civilization and civilized behavior by making it more profitable for those with whom they did business or encountered. They then carried many of the more socially-aware thoughts and attitudes back home with them. it was still about moving goods for profit – everything else was a secondary benefit, and one that a lot of people didn’t even realize was occurring. In the 19th and 20th centuries, the tail began to wag the dog, as people began to travel for the explicit purpose of exploring other cultures, purely because the cost in time and expense had come down enough to make it possible. It’s no coincidence that this was accompanied by the rise in capacity for other leisure activities, and the concurrent rapid increase in progress technologically and scientifically – people had the leisure time to think, too. Movement lies at the heart of all human progress, when you think about it!
December 20th, 2025 at 9:06 pm
This is a really useful breakdown for worldbuilding — trade routes and land transport add so much realism to a fantasy setting. Details like this make campaigns feel more alive and believable. When I take short breaks from planning games, I sometimes relax with Nulls Brawll before diving back into creative work.