Traits of Exotic d20 Substitutes pt 2: The Slightly Strange
Lots of die configurations can substitute for a d20, or for 3d6. This article looks at some of the more unusual. Part 2 of 3.
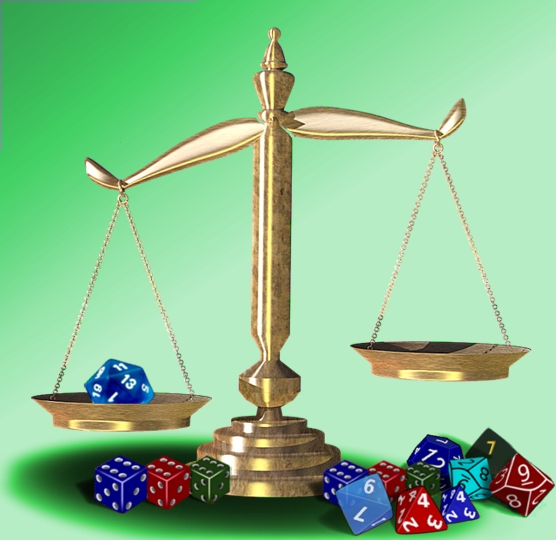
The image of the balance is by Anna Varsányi from Pixabay. I’ve changed it’s balance, added a load of dice, and changed the background color.

I made the time-out logo from two images in combination: The relaxing man photo is by Frauke Riether and the clock face (which was used as inspiration for the text rendering) Image was provided by OpenClipart-Vectors, both sourced from Pixabay.
Progress on writing this post has been a lot slower per word than I was expecting. That’s partly down to the attention to detail, partly it’s the complexity of the subject, partly its’ my refusal to do a half-arsed job, but mostly it’s the intensity of focus and concentration.
I can get about 2/3 of the way through an analysis – at which point my brain is fried. I need 30-90 minutes of recuperation before I’m ready to go again – but a part of that second session is refreshing my recollection of the results so far, in minute detail. With that taken into account, it’s two equal servings per entry.
On top of all that, there have been a couple of bonus entries added to the list along the way, so even though it only contains half the number of analyses so far, in word length this part seems fairly comparable to the first.
The upshot of all of this is that what was originally intended to be one quick post is taking 3-4 times as long as expected, and so the content has now been subdivided into three parts.
Here’s the revised table of contents:
Part 1: The Standards & Mildly Exotic:
- 4d6: The Methodology Demonstration
- d20: The Yardstick
- Boring Workaround #1: 10 x (d2-1) +d10
- Boring Workaround #2: 5 x (d4-1) + d5
- 3d6: The Standard
- Exotic Choice #1: 2d10
- Exotic Choice #2: d8+d12
- Exotic Choice #3: 2d4+d12
Part 2: The Slightly Strange
- Exotic Choice #4: 2d6+d8
- Exotic Choice #5: d10+d12-1
- Exotic Choice #6: 2d8+d6-2
- BONUS EXTRA: Exotic Choice #6a: 3d8-3
- Exotic Choice #7: d4+d6+d12-2
- BONUS EXTRA: Exotic Choice #7a: d4+d8+d10-2
Part 3: The Really Weird
- Exotic Choice #8: d4 x d6 – d4
- Exotic Choice #9: d30+1-d10
- Exotic Choice #10: 5d4 / d5
- Exotic Choice #11: (3d6+2) / d4
- BONUS EXTRA: Exotic Choice #11a: (d6 x 2d5) / d3
- Exotic Choice #12: (4d10 / 2) -d2 +1
- Summary of available d20 substitutes
- Summary of available 3d6 substitutes
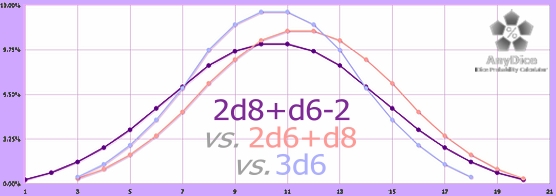
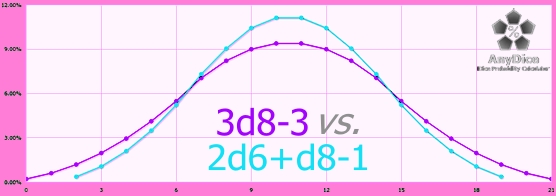
Exotic Choice #4: 2d6+d8 (vs 2d4+d12)
We start this post with a die combination that wasn’t even on my radar until I got into the last offering of part 1.
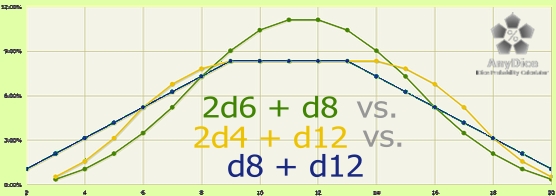
And isn’t THAT interesting! It’s a proper dumbbell curve! So much so that I had to generate a second chart…
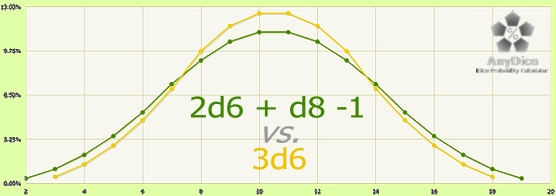
Notice that I’ve applied a -1 modifier to the 2d6+d8 curve to get it to align with the 3d6 curve.
If you had asked me before I wrote last week’s post, this is exactly what I would have expected to see from 2d6+d8 – but it’s also exactly what I expected to see from 2d4+d12, and you only have to look at the first of the graphs above to see how that worked out last time…!
Let’s dig into the specifics.
Min, Max, Ave
Minimum 3
Maximum 20
Average 11.5
The Thresholds
The 1% Threshold
1% is just below 4 and 19, in fact that are so close that I’m going to round them down to include them. so 3-4 and 19-20.
The 3% Threshold
3% is about 2/3 of the way between 5 and 6 on the low side and 1/3 of the way between 17-18 on the high side. So 5 and 18 are in this zone, everything else is not.
The 5% Threshold
Results of 7 and 16 are higher than this threshold by enough that there is a clear separation. So 6 and 17 are in this zone, while 7 through 16 are outside it.
The 10% Threshold
This falls between 9 and 10 on the low side and 13 and 14 on the high. So 7-9 and 14-16 are in this zone.
The 15% Threshold
No result gets this high, So 10-13 is below this threshold in the peak probability zone.
Four results in the peak probability range, 3 to either side of it at 5-10% probability, and every result outside of that is less than 5% likely. In fact, 3 and 20 are so unlikely that the effective range of this roll is 4-19, and 4 and 19 themselves are barely more than 1% – so for most practical purposes, the effective range is 5-18.
Slices Of Range: Percentages Of Probability
As usual, I’m going to start by breaking up the range of results and seeing what the total probability is across that range.
Range Of Results
20-3=17, plus 1 for 3 itself, is a range of 18 results. As noted above, the effective range is 4 results smaller than this, or 14 results.
Ave – Min, Max – Ave
11.5 – 3 = 8.5 (effectively 6.5)
20-11.5 = 8.5 (effectively also 6.5)
The probability curve is symmetrical.
1/3 (Ave-Min) + Min
1/3 x 8.5 is 2.8333. Adding the minimum back puts the 1/3 results mark at 5.8333.
So the low-results zone contains 3, 4, and 5.
These have a total probability of 3.47%
Six out of 10 of these results will be a 5, three out of 10 will be a 4, and 1 in ten will be a 3.
2/3 (Ave-Min) + Min
2/3 x 8.5 is 5.6666; adding the minimum marks this band as containing 6, 7 and 8. They have a total probability of 19.44 – 3.47 = 15.97%, so this band is 4.6 times as likely to contain the results of a die roll than the lowest bracket.
The Lower Core
That defines the lower core as 9, 10, and 11, with a total probability of 50 – 19.44 = 30.56%, almost twice as likely as the middle band.
The Upper Core: 1/3 (Max-Ave) + Ave
Since the roll is symmetrical in probability, this is the same size as the lower core, 30.56% and results 12, 13, and 14.
If you combine the lower and upper cores, you find that 9-14 will result more than 61% of the time!
2/3 (Max-Ave) + Ave
This will contain 15, 16, and 17, and will again hold 15.97% of the outcomes.
The Lofty Outcomes
Rolling really well will only happen 3.47% of the time, and will yield outcomes of 18, 19, and 20 when it does – with 18 being 6 in ten of the results.
2d6+d8 (vs 3d6):
03-05: 3.47% (03-05 4.63%)
06-08: 15.97% (06-08 21.3%)
09-11: 30.56% (09-10 24.07%)
12-14: 30.56% (11-12 24.07%)
15-17: 15.97% (13-15 21.3%)
18-20: 3.47% (16-18 4.63%)
I don’t know about you, but I find these numbers really interesting. The low results are not stretched in span to make room for the extra results at the top, at all – but they are even less likely to be the outcome.
The lower middle also isn’t stretched at all – but the probability total is a lot lower.
All the stretching happens at the very top of the probability curve, the most likely results – instead of a core only stretching to 12, it now continues all the way to 14.
What’s more, the total chance of those middle results occurring is significantly higher than in the case of 3d6. So 2d6+d8 manages to be wider, flatter, AND steeper than 3d6!
This, of course, is only putting some numbers on the observations that could be made just from studying the second probability chart above.
Slices Of Probability: The Definitive Result Values
Okay, so let’s slice up the 100% of outcomes into 5 bands of equal probability, in sequence of result. This is always an informative analysis!
The Lowest 20%
The lowest 20% band lands just after a result of 8, so this band contains results from 3-8.
Second Lowest 20%
We find the 40% probability total just after a result of 10 – so this entire zone consists of 9 and 10.
The Middle 20%
60% is reached just before 12, so this entire band is just one result: 11.
Second-Highest 20%
The 80% mark is just below 14, in fact it’s so close that 14 can be reasonably included. So this band is 12-14.
Highest 20%
And that leaves the 15-20 band as ‘rolling high’ with this die configuration.
As usual, I’ll now look at these results another way, dividing the peak probability into low rolls, medium rolls, and high rolls.
Peak Probability
Peak probability is shared by both results 11 and 12, and is 11.11% in both cases.
Matching Result: 1/3 Peak Probability
1/3 x 11.11% is 3.7033%, which is just above a 6 result. So 3-6, a span of 4 results, is at or below this threshold, and this is matched by 17-20 on the high side.
Matching Result: 2/3 Peak Probability
2/3 x 11.11% is 7.4066%, which is below 8. So this is a span of 2 results – a little smaller than the first span, indicating that the sides of this curve are indeed steeper.
That, of course, means the 9-15 span is at the top of the probability curve, a span of 7 results In fact, this span accounts for 100% – 2 x (11.11) = 77.78% of the outcomes.
2d6+d8:
00-20%: 3-8 (span 6)
21-40%: 9-10 (span 2)
41-60%: 11 (span 1)
61-80%: 12-14 (span 3)
81-100%: 15-20 (span 6)
< 1/3 peak probability: 3-6 (span 4)
1/3 – 2/3 peak probability: 7-8 (span 2)
2/3 – peak – 2/3 peak: 9-15 (span 7)
2/3 – 1/3 peak probability: 16-17 (span 2)
< 1/3 peak probability: 18-20 (span 3)
I’ve reformatted the second table to be more like the first because I think it might be just a little clearer. And I’ve started noting the results spans because that highlights some interesting anomalies.
Summary Of Results
You don’t have to look very hard at the first chart to see that 2d6+d8 is biased high relative to d8+d12 and biased slightly low relative to 2d4+d12. The second chart shows that it’s also biased high by a whole integer of result relative to a 3d6 roll.
For me, it’s that second probability curve that really tells the story. The 3 and 20 results are so unlikely they may as well not be there – so what we have, effectively, is a 3d6+1 curve that is significantly flatter, more d20-like, in a very wide range of the middle results.
When To Use This Substitute
As a replacement for a d20 roll, I wouldn’t use this at all. In every measure that counts, there are better options already listed, especially 3d6+1.
But as an alternative to a 3d6 roll, 2d6+d8-1 has a lot to commend it. The results are going to be more anarchic, more random – across a span that’s slightly more than 1/3 of the total, wide. The price for that is vastly lower chances of an extreme result.
But, in particular, I want to highlight how responsive this is to modifiers relative to a straight 3d6 roll. If I ‘add’ a modifier of 1 to the base 2d6+d8-1 roll (to get straight 2d6+d8), the chance of rolling particular results becomes very interesting.
03 0.35 – 0.46 = – 0.11%
04 1.04 – 1.39 = – 0.35%
05 2.08 – 2.78 = – 0.7%
06 3.47 – 4.63 = – 1.16%
07 5.21 – 6.94 = – 1.73%
08 7.29 – 9.72 = – 2.43%
09 9.03 – 11.57 = – 2.54%
10 10.42 – 12.50 = – 2.08%
11 11.11 – 12.50 = – 1.39%
12 11.11 – 11.57 = – 0.46%
13 10.42 – 9.72 = + 0.7%
14 9.03 – 6.94 = + 2.09%
15 7.29 – 4.63 = + 2.66%
16 5.21 – 2.78 = + 2.43%
17 3.47 – 1.39 = + 2.08%
18 2.08 – 0.46 = + 1.62%
19 1.04 – 0 = + 1.04%
20 0.35 – 0 = + 0.39%
If I increase the modifier from +1 to +2, giving 2d6+d8+1:
03 0 – 0.46 = -0.46%
04 0.35 – 1.39 = – 1.04%
05 1.04 – 2.78 = – 1.74%
06 2.08 – 4.63 = – 2.55%
07 3.47 – 6.94 = – 3.47%
08 5.21 – 9.72 = – 4.51%
09 7.29 – 11.57 = – 4.28%
10 9.03 – 12.50 = – 3.47%
11 10.42 – 12.50 = – 2.08%
12 11.11 – 11.57 = – 0.46%
13 11.11 – 9.72 = + 1.39%
14 10.42 – 6.94 = + 3.48%
15 9.03 – 4.63 = + 4.40%
16 7.29 – 2.78 = + 4.51%
17 5.21 – 1.39 = + 3.82%
18 3.47 – 0.46 = + 3.01%
19 2.08 – 0 = + 2.08%
20 1.04 – 0 = + 1.04%
21 0.35 – 0 = + 0.35%
And, if I increase it again from +2 to +3, giving a roll of 2d6+d8+2:
03 0 – 0.46 = -0.46%
04 0 – 1.39 = -1.39%
05 0.35 – 2.78 = – 2.43%
06 1.04 – 4.63 = – 3.59%
07 2.08 – 6.94 = – 4.86%
08 3.47 – 9.72 = – 6.25%
09 5.21 – 11.57 = – 6.36%
10 7.29 – 12.50 = – 5.21%
11 9.03 – 12.50 = – 3.47%
12 10.42 – 11.57 = – 1.15%
13 11.11 – 9.72 = + 1.39%
14 11.11 – 6.94 = + 4.17%
15 10.42 – 4.63 = + 5.79%
16 9.03 – 2.78 = + 6.25%
17 7.29 – 1.39 = + 5.90%
18 5.21 – 0.46 = + 4.75%
19 3.47 – 0 = + 3.47%
20 2.08 – 0 = + 2.08%
21 1.04 – 0 = + 1.04%
22 0.35 – 0 = + 0.35%
2d6+d8+2 has diminished chances of rolling anything below 12 (not gone) and massive boosts to the chances of a 14-18 result. 19s and 20s and even 21s will result on rare occasions, and any result below 7 is extremely unlikely.
Does it work in the other direction, you may be wondering? Well, what if I add a -1 modifier to the ‘base’ -1 to get 2d6+d8-2?
01 0.35 – 0 = + 0.35%
02 1.04 – 0 = + 1.04%
03 2.08 – 0.46 = + 1.62%
04 3.47 – 1.39 = + 2.08%
05 5.21 – 2.78 = + 2.43%
06 7.29 – 4.63 = + 2.66%
07 9.03 – 6.94 = + 2.09%
08 10.42 – 9.72 = + 0.70%
09 11.11 – 11.57 = – 0.46%
10 11.11 – 12.50 = – 1.39%
11 10.42 – 12.50 = – 2.08%
12 9.03 – 11.57 = – 2.54%
13 7.29 – 9.72 = – 2.43%
14 5.21 – 6.94 = – 1.73%
15 3.47 – 4.63 = – 1.16%
16 2.08 – 2.78 = – 0.70%
17 1.04 – 1.39 = – 0.35%
18 0.35 – 0.46 = – 0.11%
You might think that these results are comparatively mild in comparison to the big differences we saw earlier – but that’s exactly what you want – you want to penalize a PC, make life more difficult for them, but not to the point where they are helpless to do anything; that’s just frustrating.
Adding another -1 starts to grow significant:
00 0.35 – 0 = + 0.35%
01 1.04 – 0 = + 1.04%
02 2.08 – 0 = + 2.08%
03 3.47 – 0.46 = + 3.01%
04 5.21 – 1.39 = + 3.82%
05 7.29 – 2.78 = + 4.51%
06 9.03 – 4.63 = + 4.40%
07 10.42 – 6.94 = + 3.48%
08 11.11 – 9.72 = + 1.39%
09 11.11 – 11.57 = – 0.46%
10 10.42 – 12.50 = – 2.08%
11 9.03 – 12.50 = – 3.47%
12 7.29 – 11.57 = – 4.28%
13 5.21 – 9.72 = – 4.51%
14 3.47 – 6.94 = – 3.47%
15 2.08 – 4.63 = – 2.55%
16 1.04 – 2.78 = – 1.74%
17 0.35 – 1.39 = – 1.04%
18 0 – 0.46 = – 0.46%
Your chances of rolling a 14 are halved by the -2 modifier to the base roll and replacement of a d6 with d8-1. Your chances of rolling a 6 have almost doubled! (Both in comparison to a straight 3d6 roll).
You may also be wondering how this compares with a the same modifier applied to 3d6. The answer is that this penalizes characters slightly less. Again, the base roll is flatter and a little more anarchic, or perhaps you would prefer egalitarian.
So PCs would have better chance of getting themselves out of trouble, after a struggle – but they would definitely know that they have been on the wrong end of the odds at the end of that trouble.
So, when to make this substitution? The key is in the flatness of the curve and the increased unpredictability that results. In particular, I would be inclined to use this when the outcome of the roll won’t make a great deal of significant difference – increasing the anarchy while still leaving a situationl salvageable is a prompt for roleplaying, and for the awarding of a small bonus (or penalty), which, as you’ve seen, can make a significant difference!
Exotic Choice #5: d10 + d12 – 1
I gave serious thought to pulling this construction from the list. How different would it be from 2d10?
Well, as it turns out….
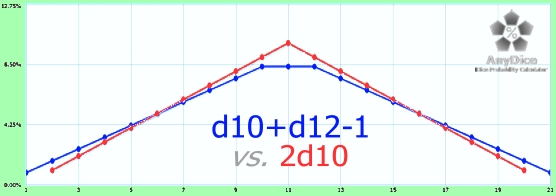
This was originally going to be about d10+d12, no -1 to be seen – but when I noticed that it aligned the result with 2d10 perfectly, simplifying the comparison, it seemed obvious to change it.
Min, Max, Ave
Minimum 1, Maximum 21, Average 11.
The Thresholds
The 1% Threshold
2 and 20 are considerably higher than 1% probability, so the only values that don’t exceed this (low) limit are 1 and 21. As explained with other analyses, anything this low might as well not be part of the roll – so the effective range of this configuration is 2-20.
The 3% Threshold
3% falls between 3 & 4 on the low side and 18 & 19 on the high. So 2-3 and 19-20 don’t reach this target.
The 5% Threshold
6 and 16 are exactly on this limit, so 4-6 and 16-18 are in this band.
The 10% Threshold
Nothing in this roll gets this high, which means that all results from 7 to 15 are more probable than on a d20 but not by very much. I keep saying it, but this is another very flat roll. That’s mostly because steepness comes with many dice – 3 or more.
That’s 9 results in the peak probability range, 6 in the 3%-5% range, 4 in the 1%-3% range, and 2 in the 0-1% range.
Slices Of Range: Percentages Of Probability
Range Of Results
21-1 = 20, plus 1 for the 1 itself, =21. This can be verified by adding up the results in the different bands above – 9+6+4+2=21.
Ave – Min, Max – Ave
11-1=10;
21-11=10. The probability curve is symmetrical.
1/3 (Ave-Min) + Min
1/3 x 10 +1 = 4.3333. That’s a little higher than the chance of getting a 5, so 1-5 form the first group of results. Collectively, these have a whopping 12.5% chance of showing up.
2/3 (Ave-Min) + Min
2/3 x 10 +1 = 7.6667. That’s just above 9, so 6-9 fall into this category. Between them, these results have a 37.5 – 12.5 = 25% chance of occurring.
The Lower Core
We haven’t had a case in this second part where we have to split a result into two bands – it happened a number of times in the first. But that’s the case this time around.
This band contains 10, and 11 has one foot in it as well (and one in the next). So the total probability encompassed by this band is 8.33 + 1/2 x 8.33 = 12.495%.
Except that it’s not. Closer examination of the probabilities shows that each increases smoothly by 0.8333333333333 etc % for each result closer to the average – which is why the ‘curve’ is actually a straight line. And, when I calculate 1 1/2 times this, with all those repeating threes, it comes to exactly 12.5%.
The Upper Core: 1/3 (Max-Ave) + Ave
In the ‘above average’ category of results, we have 11’s other half and 12, again totaling 12.5% of results.
2/3 (Max-Ave) + Ave
13 to 16 are in the ‘above average’ result category, and have a 25% chance of occurring.
The Lofty Outcomes
And that means that the best results, 17-21, will occur 12.5% of the time.
d10+d12-1:
01-05 12.5% (span 5)
06-09 25% (span 4)
10-11 12.5% (span 1 1/2)
11-12 12.5% (span 1 1/2)
13-16 25% (span 4)
17-21 12.5% (span 5)
Notice that if you put the two middle results together, you get a smooth 5-4-3-4-5 pattern of result spans. I suspect that’s because the probability increases at such regular intervals.
Slices Of Probability: The Definitive Result Values
The Lowest 20%
0-20% encompasses results from 1-6.
Second Lowest 20%
21-40% contains 7-9.
The Middle 20%
41-60% is results 10 & 11. Twelve almost makes it, but doesn’t quite get there.
Second-Highest 20%
61-80% gets us from 12 to 14.
Highest 20%
Which means, obviously, 15-21 are the highest 20% of outcomes.
Peak Probability
Three results share the peak probability of 8.33333333333333%, as can be seen on the probability chart.
Matching Result: 1/3 Peak Probability
1/3 of 8.333333333333 (I’m being careful with the rounding!) is 2.7777777778.
This is located between the probabilities for 3 and 4, and also 18 and 19. So this band contains 1-3 and 19-21.
Matching Result: 2/3 Peak Probability
2/3 of 8.333333333333 is 5.5555555556.
This falls on the curve between the results of 6 and 7, and again between 15 and 16. This band contains 4-6 and 16-18.
There’s an important lesson here. For some reason, instead of 4-6, I had written the above as “5-6 and 16-18”.
I immediately observed that these spans were of different size – 2 vs 3 results – and had a gut reaction of “that’s not right”. So I double-checked and found that there was indeed an error.
You can’t trust your instincts 100%, but as a motivation for double-checking something, they are always worth paying attention to.
That also defines, by exclusion, the peak probability zone, containing results of 7-15, a span of 9 results.
d10+d12-1:
00-20%: 1-6 (span 6)
21-40%: 7-9 (span 3)
41-60%: 10-11 (span 2)
61-80%: 12-14 (span 3)
81-100%: 15-21 (span 7)
< 1/3 peak probability: 1-3 (span 3)
1/3 – 2/3 peak probability: 4-6 (span 3)
2/3 – peak – 2/3 peak: 7-15 (span 9)
2/3 – 1/3 peak probability: 16-18 (span 3)
< 1/3 peak probability: 19-21 (span 3)
Summary Of Results
This ‘curve’ is slightly flatter than 2d10, but starts a little higher at the extreme values. The two chart lines cross at 6 on the way up and 16 on the way down. Unlike 2d10, this has a flattened probability cap over three results, creating a small plateau.
But really, it’s 2d10 stretched one result further in each direction.
When To Use This Substitute
The big thing with 2d10 is the degree of push toward the middle of the results – it’s not a lot, but it’s constant all the way through.
The d10+d12-1 alternative makes extreme results just a little more likely, and resists this push enough that it has a small probability plateau.
That means that it’s not quite as egalitarian as a d20 roll, but it’s one of the more egalitarian of the alternatives.
And that’s the key to when this option should be considered – any time a 2d10 alternative comes up as a possibility, the two factors (greater potential for extreme results, more evenly distributed result probabilities) should tell you whether or not this is a better option.
If both factors are in agreement, congratulations – the choice is made. That will usually be the case.
When they disagree, you have to decide which of the two is the more important, given the in-game context at the time – and that choice then controls, breaking the tie.
Exotic Choice #6: 2d8+d6-2
This option completes this family of related die roll options. I wasn’t all that surprised when it came up with another dumbbell curve.
This was always on my list of combinations to examine.
If you took a straightforward 3d6-3 roll (so that the minimum is zero), multiplied the result by 19/15, then added 1, you would technically be stretching the dumbbell curve to fit a 1-20 range.
There are two problems with this approach: first, it’s a fiddly three-step calculation to extract a result (and 19/15 isn’t a convenient multiple to work with, to boot), and secondly, there would be gaps due to rounding – which specific results would depend on how you rounded the results to get them to integers.
- If you round down, the gaps are found at 5, 10, 15, and 19.
- If you round off, 3, 8, 13, and 18 are impossible results.
- If your round up, you cannot ever roll 2, 6, 11, or 16.
There are always four outcomes missing because you’re stretching 15 numbers to cover 19 possible results.
I thought all along that this construction might be the answer, and that was a large part of the starting point for this 2-part article. But, cool as that might be, it lacked a purpose – which is why all the other die roll configurations were brought on-board.
Min, Max, Ave
Minimum 1, Maximum 20, Average 10.5. And it’s a perfect bell curve.
The Thresholds
As usual, we start by looking at the probabilities of individual results and classifying them into bands.
You may be wondering why I chose the bands that I did. I started with 5%, because that’s the d20 probability of results; anything more than this will be more probable than on a d20 roll, anything below it will be less.
Everything from that is roughly a multiple of 2, or of 1/2.
- 5 x 2 = 10.
- 5 x 1/2 = 2.5, which either rounds to 2 or 3 – I chose 3 as being more ‘in the middle’.
- 5 x 1/2 x 1/2 = 1.25, which can only reasonably round to 1.
- Finally, I knew some curves would have some probabilities above 10, so I needed a cut-off for the most extreme results. The technically-correct choice would have been 20%, but it takes a d4 or d5 to get up that high, so this would not have been all that useful. So I compromised on 5 x 3 = 15.
The 1% Threshold
Just above 2 the curve crosses this mark, and just before 19 on the way down. So 1-2 and 19-20, spans of 2 results.
The 3% Threshold
A little beyond 4, this line is crossed, and a little before 17, it gets crossed again going the other way. So 3-4 and 17-18. These are also spans of 2 results.
The 5% Threshold
With most bell curves, this is usually the vicinity of the inflection point, where the probability starts rising comparatively quickly. That results in smaller spans – in other words, we get to 5% from 3% a lot more quickly.
So it is in this case: the 3-5% band contains just two results, 5 and 16.
The 10% Threshold
Almost all remaining results fall into the range of 5-10% probability. Only the very peak – 10 & 11 – lie above this limit. So the 5-10% range contains 6-9 (a span of 4) and 12-15 (likewise).
Slices Of Range: Percentages Of Probability
Next, we break up the range of results into 6 groups as evenly as possible – 3 low and 3 high – and see what the probabilities are for each group and which results they contain.
Range Of Results
20-1=19; +1 for the 1 itself = 20.
Ave – Min, Max – Ave
10.5 – 1 = 9.5. And 20 – 10.5 also = 9.5. So the curve is symmetrical, as has been the case for every construction that we’ve looked at so far – but won’t always be true.
1/3 (Ave-Min) + Min
1/3 x 9.5 + 1 = 4.16667. This is the division point between worst results and poor results – so 1 to 4 are the worst results. These have a combined probability of 5.21% and a span of 4.
2/3 (Ave-Min) + Min
2/3 x 9.5 + 1 = 7.333, so that sets the ‘poor results’ as 5-7.
The total probability of a poor result is 21.61 – 5.21 = 16.4%. This bracket spans 3 results. 16.4% is a little over three times 5.21%, so these are about three times as likely to occur as the worst results.
The Lower Core
Everything between 7.333 and the average of 10.5 is a ‘below average’ roll, by definition. so results 8-10 fall into this bracket.
This band spans 3 results and has a total probability of 50 – 21.61 = 28.39%.
28.39% is about 1.73 times 16.4%, so this band is not that much more probable than a poor result. That speaks to this being a relatively flat probability curve.
The Upper Core: 1/3 (Max-Ave) + Ave
Because the curve is symmetrical, this will mirror it’s below-average counterpart – span of 3 and 28.39% probability. So that defines this band as containing 11, 12, and 13.
2/3 (Max-Ave) + Ave
For the same reason, this is also a span of 3 and has a total probability of 16.4%. That encompasses 14, 15, and 16.
The Lofty Outcomes
And that leaves the final span of 4 results (17, 18, 19, and 20) with a combined probability of 5.21%.
2d8+d6-2 (vs 2d6+d8-2):
01-04: 5.21% (01-03: 3.47%)
05-07: 16.4% (04-06: 15.97%)
08-10: 28.39% (07-09: 30.56%)
11-13: 28.39% (10-12: 30.56%)
14-16: 16.4% (13-15: 21.3%)
17-20: 5.21% (16-18: 4.63%)
That this probability curve is even flatter than 2d6+d8 is obvious, and for the same basic reason that 2d6+d8 is flatter than 3d6 – it’s range stretches out two extra results, to a top of 20 from a top of 18.
That flatness manifests as a lower chance of a result in the lower and upper core probabilities and an increased chance of a result outside of that central region. Those ‘outside results’ will still cluster toward the average, because that’s what bell-shaped curves do – but this result is even more extreme than 2d6+d8 in that department.
Slices Of Probability: The Definitive Result Values
Finally, we slice the probability ‘cake’ two ways – first into bands of 20% from lo high, and then as equal portions of the peak.
The Lowest 20%
Results of 1-6 are the lowest 20% in terms of probability. 7 is almost low enough, at 21.61% cumulative, to be included in this category as well.
Second Lowest 20%
The bracket from 20% to 40% encompasses results from 7 to 9. Note that 9 only just scrapes in, with a total cumulative probability of 39.84%.
The Middle 20%
Sitting across the middle, the 40-to-60% range contains results 10 and – being generous – 11. The cumulative probability is 60.16%, that’s close enough for inclusion I think.
Second-Highest 20%
The 60-to-80% group comprises results 12 and 13.
Highest 20%
Which, in turn, means that 14-20 are the highest 20% of results that will occur.
Peak Probability
There are two results at the peak of probability: 10 and 11. That peak is 10.16%.
Matching Result: 1/3 Peak Probability
1/3 of 10.16 is 3.3867%. This is close to a result of 5’s probability but not close enough. So the “polar lines” of this die configuration separate 1-4 and 17-20 from the rest of the results. That’s two spans of 4 results each.
Matching Result: 2/3 Peak Probability
2/3 of 10.16 is 6.7733%. That’s more-or-less midway between results 6 & 7 – so the “tropical lines” of this configuration exclude 5 & 6 and 15 & 16 from the remainder. Those are spans half the size of the previous band.
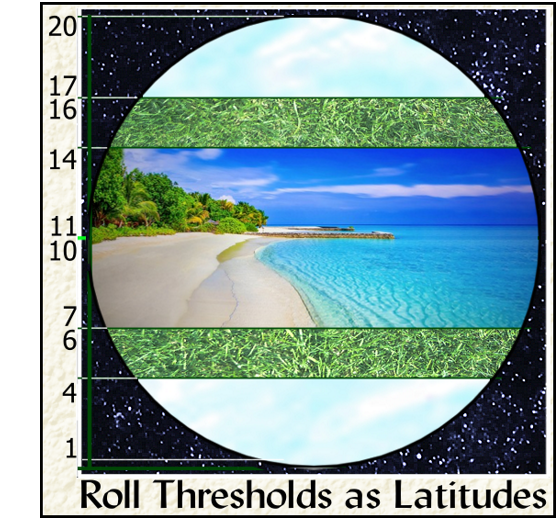
Living “in” those tropics are 7 to 14. A span of 8 results, divided across the “equator” that is the average roll (10.5) – so two spans of 4. The “Temperate Zone” that would result if these corresponded to latitude markers would thus be extremely narrow.
What’s all this talk about “Latitudes” all of a sudden? Long-time readers know me, I’m always looking for a different metaphor to help people visualize what I’m describing – and this one just came to me.
2d8+d6-2:
00-20%: 1-6 (span 6)
21-40%: 7-9 (span 3)
41-60%: 10-11 (span 2)
61-80%: 12-13 (span 2)
81-100%: 14-20 (span 7)
Notice that rounding errors have ‘stolen’ 14 from the 61-80% band and given it to the 81-100% band.
< 1/3 peak probability: 1-4 (span 4)
1/3 – 2/3 peak probability: 5-6 (span 2)
2/3 – peak – 2/3 peak: 7-14 (span 8)
2/3 – 1/3 peak probability: 15-16 (span 2)
< 1/3 peak probability: 17-20 (span 4)
At least this table is symmetrical!
Summary Of Results
It’s a bell curve that runs smoothly from 1 to 20. The peak probability is a little less than a 3d6, but that’s understandable given the stretching across 20 results. Minimum, Maximum, Average – they are all bang on. If you want to replace a d20 with a bell curve, they don’t come much better than this.
When To Use This Substitute
I think the question then has to be asked, why use 2d6+d8-1 when you’ve got 2d8+d6-2? And it’s a fair question, if interpreted as “Under what circumstances would you NOT prefer to use 2d8+d6-2?”
For the answer, I think we need to go back to the probability chart with which this analysis started. Here it is again:
Compare the two. 2d6+d8 starts, natively, with the same result as 3d6 and stretches to 20, a full 2 points higher than a 3d6 roll goes. That shifts its peak forward – it will tend to roll high. And that always helps make players happy. It’s completely fair if the NPCs / monsters are using it too – it just makes everything that little more dramatic, that little bit more inclined towards a success than a failure – which, once again, is completely fair if both sides get the same benefit. Tacking on the -1 to the base roll shifts the curve so that it fits perfectly on top of a 3d6.
This roll, 2d8+d6-2, starts two lower than a 3d6 roll and still ends two higher, and the probability curve is flatter. It’s less dramatic than a 2d6+d8 plus modifiers-1, and that is the real point of difference between the two.
Whenever I want the PCs to feel like they were winning (even if they weren’t), any time I wanted to push or milk the drama of a situation, I would choose the 2d6 variant, with modifiers.
Any time I wanted to calm the players, while still retaining the advantage of a bell curve over a flat line, I would consider replacing the normal d20 with 2d8+d6-2. Making extreme results less likely makes them more significant, more special, but also makes them less of a problem any time you want to soak the campaign in Calm for a while.
The difference is psychological and all about controlling the emotional pacing of the campaign. I’ve written two major series on that subject:
– and this is absolutely going into my locker of techniques as a tool to help make the drama ebb and flow. You want it to ebb (at the right times) so that when you ratchet things up, there is a visceral reaction to the excitement.
As a replacement for 3d6, this option creates the latitude and some of the probabilistic diversity of results that you get with a d20 while retaining the trend for results to be consistently average, most of the time. A best of both worlds, if you will.
As a replacement for a d20, this retains the potential for extreme results while making those more unlikely, introducing the ‘trend toward the average” of a bell curve.
In both cases, the difference is in extreme results and their merits under the circumstances of the campaign.
BONUS EXTRA: Exotic Choice #6a: 3d8 – 3
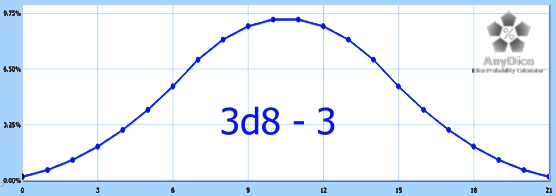
When I look at this chart, the adjective that comes first to mind is that it ‘lopes’ casually from one extreme to the other.
I want to draw attention, right off the bat, to the fact that 0 and 21 have a 0.20% probability. You would expect to see each once in every 500 rolls. Outside of theoreticals, for all practical purposes this is a gentle bell curve from 1 to 20.
Min, Max, Ave
Minimum 0
Maximum 21
Average 10.5
The Thresholds
The 1% Threshold
The 1% chance falls between 1 and 2. So 0-1 are below this threshold. On the high side, it’s 20 and 21.
The 3% Threshold
The 3% line is just above 4, so 3 and 4 are below this threshold, and 18 & 19 are the high-side equivalents. These will come up less than half as often as with a d20 roll.
The difference between this and 3d6 are more interesting – a total probability of 6.84% in this case plays a total probability of 1.85%, or 3.7 times as likely.
The 5% Threshold
The 5% line is between 5 and 6, so this no-dices-land contains just two entries – 5 and the corresponding high result, 17.
The 10% Threshold
Nothing quite gets to the 10% mark, so everything else is more probable than a d20 rolls but nothing is twice as likely.
3d6 has much sharper sides and a taller peak. So most results in this range will occur less often.
6-16 is a span of 11 results, the largest that we’ve seen to date.
Completely irrelevant but very interesting – I wanted to look into the differences between 3d8-3 and 3d6. So I tried division and got the expected result, which wasn’t especially illuminating. To make sure that the curve captured the nuance, though, I multiplied the 3d8-3 result by 10.
So I changed the division to a subtraction, and – in a momentary lapse in concentration – forgot to take away the times 10.
The results are predictable, beautiful in their own way, and very strange! I had to share them with readers :)
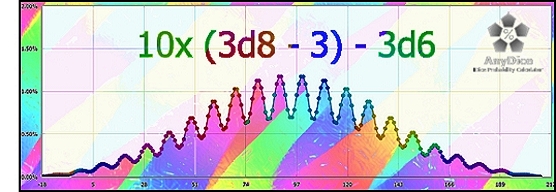
Definitely one of the weirdest probability charts that I’ve ever seen!
Slices Of Range: Percentages Of Probability
Range Of Results
Results span from 0 to 21, so 22 wide.
Ave – Min, Max – Ave
No surprises here – 10.5 – 0 = 10.5, and 21-10.5 = 10.5. Both are the same, so the curve is symmetrical.
1/3 (Ave-Min) + Min
1/3 x 10.5 + 0 = 3.5. So the lowest results band contains 0-3. There’s a cumulative probability of 3.91% for this group of results.
2/3 (Ave-Min) + Min
2/3 x 10.5 +0 = 7. Which means that 7 has one foot in the middle lower band and the other in the lower core.
This band therefore contains 4-7, which have a cumulative probability of 23.44 – 1/2 x 7.03 – 3.91 = 16.015%. That’s a little more than 4 times the low band.
The Lower Core
Results 8-10, plus half of 7, form the lower core, the below average results. There is a cumulative probability of 50 – 23.44 + 1/2 x 7.03 = 30.075%.
The Upper Core: 1/3 (Max-Ave) + Ave
Because the curve is symmetric, this is the same size as the lower band, containing 11-13 plus 1/2 of 14. The cumulative probability of these results is also the same at 30.075%.
2/3 (Max-Ave) + Ave
The middle upper band hold results of 15-17 plus half of 14, with a cumulative probability of 16.015%.
The Lofty Outcomes
The best results band runs from 18-21, and have a total probability of 3.91%.
3d8-3:
01-04: 3.91% (span 4)
05-07: 16.015% (span 2.5)
07-10: 30.075% (span 3.5)
11-14: 30.075% (span 3.5)
14-17: 16.015% (span 2.5)
18-21: 3.91% (span 4)
If I were to ignore the math and go for the more aesthetically-pleasing breakup, 7 shifts completely into the middle lower band, and 14 into the middle upper band, and that looks like this:
01-04: 3.91% (span 4)
05-07: 19.53% (span 3)
08-10: 26.56% (span 3)
11-13: 26.56% (span 3)
14-17: 19.53% (span 3)
18-21: 3.91% (span 4)
The previous section of results highlighted the massive span covered by the probability range of 5-10%, and that same message is reinforced by the small difference in probability distribution shown. The ‘correct’ breakup emphasizes the differences a little more – 30.075% is almost twice 16.015% – but the ‘aesthetic’ breakup, in which the core bands are only 1.36 times as probable as the middle bands puts things into a clearer perspective, I think.
Slices Of Probability: The Definitive Result Values
The Lowest 20%
Breaking up the outcomes by probability, the 20% line falls between 6 and 7, so one-fifth of results will be 0-6.
Second Lowest 20%
The 40% mark is just below 9, so the next 1/5th of results are 7s and 8s.
The Middle 20%
The 60% mark is just above 11, so the middle band holds 9-11.
It’s interesting that the second lowest 20% only had a span of 2 results, while this band has a span of 3, and those are 3 of the 4 most probable outcomes.
That highlights why this approach to analysis, while sometimes useful, is employed way too often and can be misleading.
Second-Highest 20%
80% lands between 13 and 14. So the second-best 20% of results will be 12s and 13s.
Highest 20%
Which means that the best 20% of results will contain everything from 14 to 21, a span of 8 results.
The real problem is that the actual rolls will be fuzzy around the edges. 8^3= 512 combinations of die faces. Exactly 1 of them will be 0; so many will be 1, so many will be 2, and so on. The odds that 20% won’t include some that are on this side or that of the dividing line are remote to say the least.
The cumulative probability through to results of 6 is 16.41% – and 16.41% of 512 is 84.0192. We can assume that the extra decimal places are rounding errors and say that from 512 rolls, 84 of them will be 6 or less.
The cumulative probability through to results of 7 is 23.44%, because 7s have a 7.03% chance of showing up. 7.03% x 512 = 35.9936, and again, the difference from a whole number is down to rounding errors. So you would expect 36 results of 7 from the 512 rolls, and some of them will be in the lowest 20% of the 512 rolls, and some will be in the band above it.
It gets worse: a perfect 20% of 512 is 102.4 rolls. What does “0.4 rolls” mean? Does it mean that 0.4 of a result of 7 goes onto one side of the line (2.8) while the rest (4.2) goes onto the other?
The point is this: there are inherent and unavoidable limits to precision that can and do distort results. You need to take this into account when analyzing die rolls (or when interpreting someone else’s analysis).
The differences show up all the time in computer technology. “One K” is 1024 bytes, not 1000. “One Meg” is 1024 K, or 1048576 bytes.
But disk manufacturers use “Meg” in the “1,000,000” sense because it makes their hard disks sound larger – so a “1 Meg” hard disk (or USB stick, these days) is 1.048576 Megabytes. And a 4.3 Gb disk is roughly 4.3 thousand million bytes of capacity and technically is really only 4.004687 Gb, or 4100.8 Mb.
Don’t expect to pack 1024 four-point-three megabyte files onto one, because you won’t (but some unscrupulous manufacturers used to charge as though you could).
What’s more, not every byte of storage will be accessible; some of them are used to label blocks of information, and you can’t have a block that’s partially one file and partially another. So actual size on the storage medium always rounds up to the size of a block.
Back when 100Mb was the ‘typical size’ of a hard disk, and I was in the IT support game, the number of calls we used to get from irate users whose new Hard Disk showed only 97 Mb was astonishing – and it all stems from the difference between 1024 and 1000.
Peak Probability
Results of 10 and 11 share the peak probability of 9.38%.
Matching Result: 1/3 Peak Probability
1/3 x 9.38 = 3.1267%. This lands in between 4 and 5 on the low side and 16 and 17 on the high. So the low probability results are 0-4 and 17-21.
Matching Result: 2/3 Peak Probability
2/3 x 9.38 = 6.2533%. This is found between 6 & 7 on the low side and 14 & 15 on the high. So intermediate probability results are 5-6 and 15-16.
That means that high-probability results are 7-14.
3d8-3:
00-20%: 0-6 (span 7)
21-40%: 7-8 (span 2)
41-60%: 9-11 (span 3)
61-80%: 12-13 (span 2)
81-100%: 14-21 (span 8)
< 1/3 peak probability: 0-4 (span 5)
1/3 – 2/3 peak probability: 5-6 (span 2)
2/3 – peak – 2/3 peak: 7-14 (span 8)
2/3 – 1/3 peak probability: 15-16 (span 2)
< 1/3 peak probability: 17-21 (span 5)
These show properties of bell-curves that you see all the time. The 20%-band breakups shuffle extreme results off to the top and bottom; 25-50% of these will never show up unless you roll a lot (or get very lucky or unlucky). The peak probability scales the extremes more usefully, but shifts medium-probability outcomes into the peak bracket because of the steep sides of the bell curve, and the natural ‘crown’ of the curve..
Summary Of Results
When I look at the two of them side-by-side (or one above the other as they appear in my Window), the comparison of greatest interest and that is the most compelling is with 2d6+d8-3.
The 3d8-based roll is flatter but broader, with an increased chance of extreme results – and those results extend further to both the left and the right.
The crossovers are between 5-6 (low) and 14-15 (high), so results of five or less and of 15 or more are more likely while the distribution of probability from 7-14 is more even.
When To Use This Substitute
The thing that strikes me most about this construction, especially in comparison to 2d6+d8-1, is how much room there is for positive modifiers.
For it to be useful, therefore, two conditions have to be met. First, a positive modifier has to be applicable. Any amount from +1 to even as high as +6 is fine. And second, I have to be willing to live with the chance of an extreme result, even a result as high as 24 or 25 (only possible with a +3 modifier or better).
This configuration already has an average of 10.5, and every +1 modifier increases that by 1. So this is most useful for rolls when I want the PCs to succeed but need to still preserve a chance of failure, no matter how slim that might be.
Exotic Choice #7: d4+d6+d12-2
Here’s the secret sauce to any substitution of a single dice: for every extra die you’re adding, increase the desired maximum by 1 so that you can include a default modifier that brings the minimum, maximum, and average back to what you want. So, 1 dice -> 2 dice? Aim for a maximum of D#+1. 1->3 dice? Aim for a maximum of D#+2, and so on.
Single dice have a minimum of 1, unless modified in some way, and that points the way to adjusting that principle for the replacement of N dice. The best approach is to reduce both minimum and maximum by (N-1), effectively putting the construction on a shape that looks like that of a single die. You get bonus points for making the modifier in the D#+modifier cancel out that (N-1). 3 dice -> 2 dice? That requires an (N-1) of -2, and a D#-1 to boot. 3 dice for 3 dice? (N-1) of 2, and D#+0.
Which brings me to this particular construction. It has every opportunity for every feature we’ve seen to date, and I have no idea what to expect. 3 dice, so a bell curve, differences in die sizes, so maybe a plateau. – who knows? I wouldn’t be all that surprised if it looked like a step pyramid with the top missing!
Let’s see what we get…
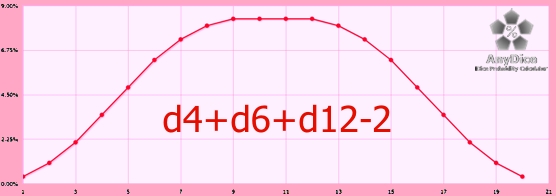
Is that it? My first reaction was to be underwhelmed. But then I started noticing details.
There’s an obvious inflection point at 3 – but then there’s another one at 6, and the two are linked by what appears to be a plumb-straight line. The same is true of the descending side of the curve, with the inflection points being 15 and 18.
These inflection points are of opposite sign – the first steepens the increase in probability and the second one diminishes it. We’ve seen that before, with the 2d4+d12 curve (from part 1) – but that had inflection points on successive results, so they were even less obvious.
There’s a central plateau. that’s 4 spaces wide and then a very gentle rolling off on both sides, which is also reminiscent of 2d4+d12 – but that had comparatively steep sides and a larger plateau.
The scales can be hard to read, but 4.50% half-way up means 9% at the top and the intermediates are, well, in-between. 9% is a fairly high probability for a d20 substitute but not an atypical one. Some rolls, like 3d6, go even higher at the peak of their bell-curves. The peak probability looks very similar to 2d4+d12, which had the exact same peak probability as d8+d12.
What it doesn’t seem to have is the bias that 2d4+d12 exhibited – it was always either biased high or low relative to 3d6.
So there’s a lot of subtlety going on, and plenty to talk about.
Min, Max, Ave
Minimum 1
Maximum 20
Average 10.5
The Thresholds
The 1% Threshold
Results of 2 and 19 happen at 1.04%. This is so close to the line that they should be included – so 1-2 and 19-20 are really improbable results, akin to rolling 01 or 00 on d%, or worse.
The 3% Threshold
3% falls in between 3 and 4, and again between 17 and 18. So results of 3 and 18 will occur about half as often as they would on a d20.
The 5% Threshold
5% divides 5 from 6 and 15 from 16. So results of 4-5 and 16-17 will occur a little less frequently than they do on a d20.
The 10% Threshold
Nothing gets above this on the chart. In fact, as noted earlier, nothing even gets as high as 9%. So everything from 6 to 15 will come up more often than on a d20 – but not as much as twice as often.
Slices Of Range: Percentages Of Probability
Range Of Results
This combination gives a range of 20 results, obviously.
Ave – Min, Max – Ave
Both of these calculations yield ranges of 9.5, so the curve is symmetrical.
1/3 (Ave-Min) + Min
1/3 x 9.5 + 1 = 4.16667. This divides worst outcomes (1-4) from the rest. There’s a combined probability of 6.94%; 2d8+d6-2 had the same set of outcomes, but only a 5.21% chance of them occurring.
This curve has a flat – steep – flat – steep – flat thing happening, courtesy of it’s total of 4 inflection points. What this probability total shows is that the flattest parts are even flatter than some of the others that we’ve examined, making it more possible to get extreme results.
2/3 (Ave-Min) + Min
2/3 x 9.5 + 1 = 7.3333, so 5-7 are the ‘poor but not worst possible’ results. These have a combined probability of 25.35 – 6.94 = 18.41%.
Again, this is higher than the results of 2d8+d6-2 but occupies the same range.
This section of the curve carries us past the first inflection point and into the ‘steady rise’ part of the graph.
The Lower Core
That means that the lower core has the peak probability, the second inflection, and most of the steep-rise section between the inflection points – an absolutely huge total probability. Results of 8-10 are in this zone, and they have a total probability of 50 – 25.35 = 24.65%.
Another indicator of the overall flatness of the probability curve is how close this total is to the previous one, despite all those noteworthy inclusions – 24.65% vs 18.41% is not a huge difference, by any means. More of the probability is spread over more extreme results with this construction.
The Upper Core: 1/3 (Max-Ave) + Ave
Since we know the curve is symmetrical, this is the same total percentage chance as the lower core, 24.65%, and the same span of results – in this case, from 11-13.
2/3 (Max-Ave) + Ave
Better than merely “above average”, the good results band spans from 14-16, and has a total probability of 18.41%.
The Lofty Outcomes
Which leaves the ‘best’ results as 17-20, with a total probability of 6.94%.
d4+d6+d12-2:
01-04: 6.94% (span 4)
05-07: 18.41% (span 3)
08-10: 24.65% (span 3)
11-13: 24.65% (span 3)
14-16: 18.41% (span 3)
17-20: 6.94% (span 4)
The only results here that are so unlikely they are only theoretically possible most of the time are 19-20. At 0.35% each, they can be expected to appear once each in every 288 rolls.
If you take these out, the very even spread of results that you get from the table above becomes evident.
Slices Of Probability: The Definitive Result Values
The Lowest 20%
20% probability (cumulative) falls above 6 but below 7, so 1-6 form the lowest band of results. Notably, 1-4 are 10% of results and 5-6 are the other 10%.
Second Lowest 20%
40% probability is reached between 8 and 9 – the latter almost gets into this category but is not quite close enough. So this band contains results of 7 and 8.
The Middle 20%
60% probability is between 11 and 12, so results from 9 to 11 can be found here.
Second-Highest 20%
The 80% mark is just below 14, so this band is 12-13.
Highest 20%
That leaves 14-20 as the highest 20% of results. As with the lowest 20%, 14-15 are 10% of the results and 16-20 are the remainder.
Peak Probability
Peak probability is 8.3333% – again.
If you search the two articles for 8.33, you’ll find that this peak probability occurs time and time again. There’s obviously some significance to that, it’s happened too often to be a coincidence, but what it might be escapes me.
So I asked an AI, and what I got back highlights that 8.3333% is the same as 1/12, and the various combinations where this has resulted all have dice that are factors of 12 – four, six, twelve – and so the peak probability is going to be a numeric fraction of the possible results that will simplify to 1/12.
It also pointed out that the size of the plateau. is always equal to the size of the smallest dice in the combination, an observation that I had already noticed for myself, but that I hadn’t mentioned because I didn’t have a large enough sample to be sure of the relationship.
Matching Result: 1/3 Peak Probability
1/3 x 8.3333% = 2.7777%. Only the results of (low) 1-3 and (high) 18-20 are below this threshold.
Matching Result: 2/3 Peak Probability
2/3 x 8.3333% = 5.5555%. This threshold is exceeded by 6 (low) and 15 (high) so 4-5 and 16-17 are in this band.
Which means that 6-15 are in the top third of results in terms of probability – a span of 11 results!
d4+d6+d12-2:
00-20%: 1-6 (span 6)
21-40%: 7-8 (span 2)
41-60%: 9-11 (span 3)
61-80%: 12-13 (span 2)
81-100%: 14-20 (span 7)
< 1/3 peak probability: 1-3 (span 3)
1/3 – 2/3 peak probability: 4-5 (span 2)
2/3 – peak – 2/3 peak: 6-15 (span 11)
2/3 – 1/3 peak probability: 16-17 (span 2)
< 1/3 peak probability: 18-20 (span 3)
Summary Of Results
The probability curve and that last table of results are, to me, the definitive characteristics of this die combination.
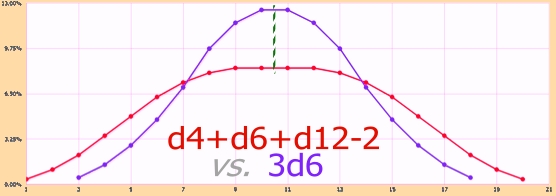
When To Use This Substitute
In a nutshell, this is an alternative to 2d8+d6-2. it can be used anytime you would consider using that configuration. The question then becomes, when to use this choice instead of that one. To find out, I generated one more probability chart comparing the two.
It’s clear that this is a flatter, squatter version of that chart, with greater potential for extreme results. There is still a strong central plateau. – results from 6 to 15 are far more likely than anything outside that range – but results outside that range will still occur. 1-5 and 16-20 results each contain 4.86% of the outcomes – so 4.86% x 4 x 6 x 12 = 14 in 288 times, each. Between them, 7 in 72 outcomes will be outside the ‘core range’ – which means that 65 out of 72 will be inside that range.
So if you want a 2d8+d6-2 chart, but with a (slightly) increased potential for extreme results and a more even spread of results, this is the option to choose.
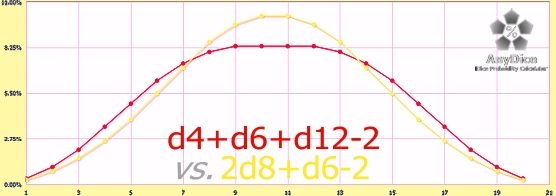
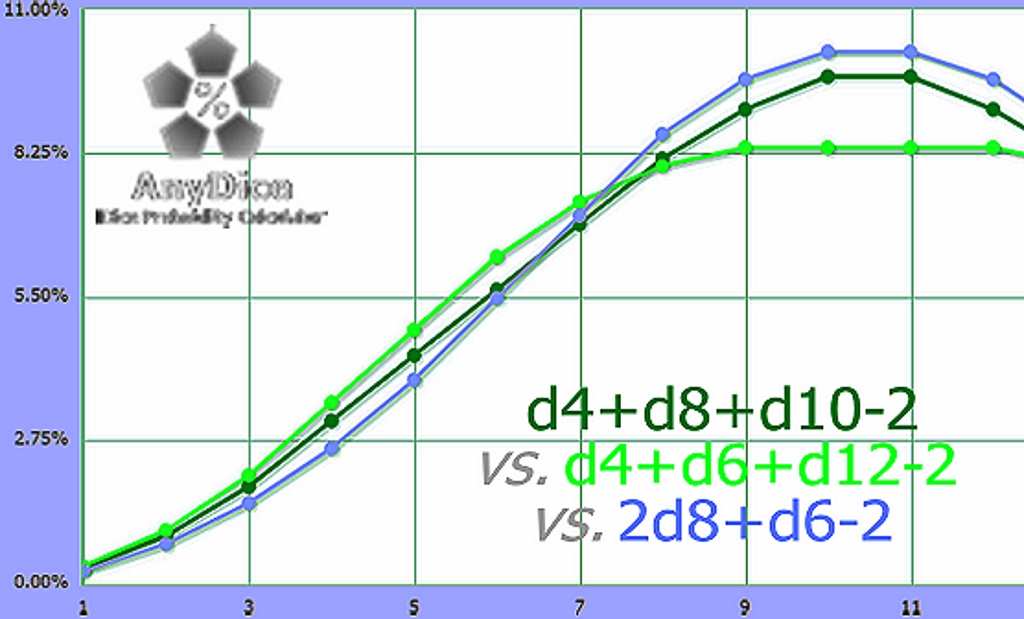
BONUS EXTRA: Exotic Choice #7a: d4+d8+d10-2
Another of the curves that weren’t on my list, this is a variation on the previous one. The d6 has grown to a d8 and the d12 has shrunk to a d10 – and the results should be quite interesting in comparison. I don’t expect to dig too deeply into this one (or this article won’t be ready in time, I’m already pushing my luck), but it needs to be included, I think.
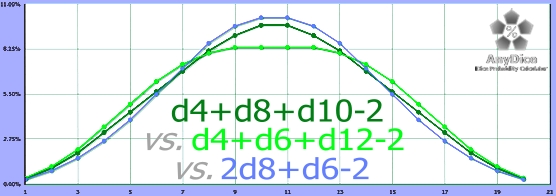
These three curves are so close together that to be be able to show things clearly, I’m going to need to offer up an enlargement.
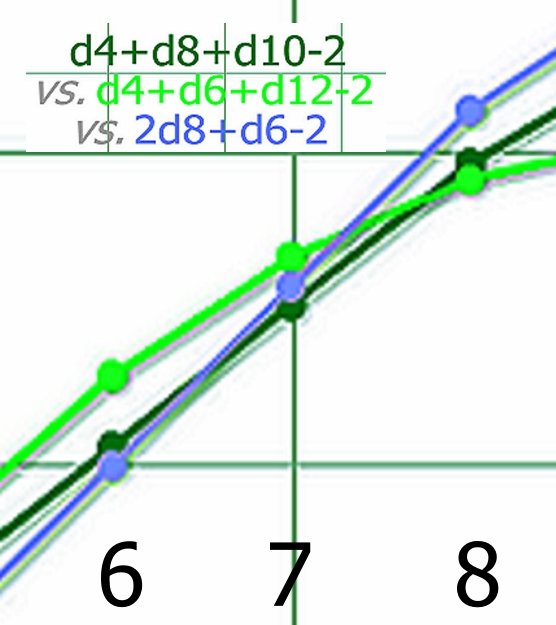
Even this wasn’t enough, so if you click on the thumbnail above, it will open a still-larger version in a new tab. But below is an even-more-enlarged extract from that image, focusing on the complex interplay between results 6 and 8.
So. what do I see when I examine this?
The previous combination told me that this curve was going to be closely related to both that (d4+d6+d12-2) and 28+d6-2, analyzed earlier.
The relationship between this new construction and those alternatives was going to be critical to evaluating it. So I deliberately included them in the probability chart for comparison purposes.
The results show that for the most part, this curve is bound by those others, occupying some middle ground between them. Initially, d4+d6+d12-2 has the higher probabilities, and this curve tracks along with it fairly closely in shape.
However it does slowly lose ground to that roll and gets closer to 2d8+d6-2. Between 6 and 7, they cross, and for a single result (7), d4+d8+d10-2 is actually the lowest of the probability curves.
That doesn’t last because between 7 and 8, 2d8+d6-2 flattens out massively, heading for it’s broad plateau.; it crosses both the other probability tracks before 8 is reached.
It started as the highest of the three, and at that crossover point, abruptly switches to being the lowest.
The object of our interest, meanwhile, tracks very closely to 2d8+d6-2 right up to the point of peak probability and back down to the equivalent situation on the high side.
The differences in probability are very subtle up to the point where d4+d6+d12 flattens out and crosses over the other constructions and remain so when comparing d4+d8+d10-2 with 2d8+d6-2.
To sum up the differences in a nutshell:
- Compared with d4+d6+d10-2, this curve is a full dumbbell curve; extreme results are slightly less likely but central results are far more likely. The crossover point between the two is between 7 & 8 and 13 & 14.
- Compared with 2d8+d6-2, this curve makes extreme results a little more likely and centralized results a little less likely. The crossover point is between 6 & 7 on the low sides and between 14 & 15 on the high.
Min, Max, Ave
Minimum 1, Maximum 20, Average 10.5.
The Thresholds
The 1% Threshold
1 & 2, and 19 & 20, are clearly below this threshold. Not by a lot in the innermost of these results, but enough. I’ll round 0.04% difference, I won’t round 0.06%.
The 3% Threshold
This is just below 4 and 17 – so the only results in this bracket are 3 and 18.
The 5% Threshold
Between 5 & 6, and 15 & 16, is where this line sits, so this area contains 4-5 and 16-17.
The 10% Threshold
The probability curve never quite gets to this threshold, so everything from 6 to 15 falls into this region.
Slices Of Range: Percentages Of Probability
Range Of Results
1 to 20, obviously.
Ave – Min, Max – Ave
Both low and high ranges span 9.5 results. The curve is symmetrical.
1/3 (Ave-Min) + Min
Breaking the range of results up into 6 bands as evenly as possible is the name of this game.
1/3 x 9.5 + 1 = 4.16667. That lands between results 4 and 5 (closer to 5), so this band contains 1-4. The cumulative chance of a result in this range is 6.25%.
2/3 (Ave-Min) + Min
The next band up divides at 7.33333. That holds results 5-7. The cumulative chance of one of these showing on the dice after a roll is 23.13 – 6.25 = 16.88%.
The Lower Core
The below average results range takes us through 8, 9, and 10. There’s a cumulative 50 – 23.13 = 26.87% chance that one of these results from a roll.
The Upper Core: 1/3 (Max-Ave) + Ave
Because the results are symmetrical, this has the same characteristics as the Lower Core – a span of 3 results (11, 12, and 13) and a total probability between them of 26.87%.
2/3 (Max-Ave) + Ave
Similarly, this is the same as the medium-poor results – a span of 3 (14, 15, and 16) and 16.88% probability.
The Lofty Outcomes
That leaves 17, 18, 19, and 20 at the top of the tree, sharing a net 6.25% probability.
d4+d8+d10-2:
01-04: 6.25%
05-07: 16.88%
08-10: 26.87%
11-13: 26.87%
14-16 16.88%
17-20: 6.25%Slices Of Probability: The Definitive Result Values
The Lowest 20%
This threshold is almost exactly midway between results of 6 & 7. So 1-6 are in the lowest 20% of outcomes that will occur.
Second Lowest 20%
This is just below 9. It’s so close that I’m willing to include that result. So this set of 20% of the outcomes is 7-9.
The Middle 20%
60% is just over 11, so there’s no controversy in including it in this band, which therefore contains 10 & 11.
Second-Highest 20%
The 80% mark falls between 13 and 14, according to AnyDice’s ‘at most’ cumulative probability chart. So this 20% band contains 12-13.
I’d like to have included 14, but at a cumulative total of 83.75%, it’s just too big a stretch.
Highest 20%
That leaves 15-20 as the members of the top-tier 20%. And half of that 20% is 15 alone.
Peak Probability
10 & 11 share the peak probability of 9.69%.
Matching Result: 1/3 Peak Probability
1/3 x 9.69 = 3.23%. That says that 1-4 occupy this bottom rung of the probability ladder, along with 17-20.
Matching Result: 2/3 Peak Probability
2/3 x 9.69 = 6.46%. This is just below 7 & 14. So 5-6 and 15-16 occupy this intermediate rung.
That leaves 7-14 as the most probable results, all characterized by a chance greater than 2/3 of the peak.
d4+d8+d10-2:
00-20%: 1-6 (span 6)
21-40%: 7-9 (span 3)
41-60%: 10-11 (span 2)
61-80%: 12-13 (span 2)
81-100%: 14-20 (span 7)< 1/3 peak probability: 1-4 (span 4)
1/3 – 2/3 peak probability: 5-6 (span 2)
2/3 – peak – 2/3 peak: 7-14 (span 8)
2/3 – 1/3 peak probability: 15-16 (span 2)
< 1/3 peak probability: 17-20 (span 4)Note that these tables are exactly the same as 2d8+d6-2. That’s how small the difference between them is.
Summary Of Results
Functionally, this is the same as 2d8+d6-2. The probability differences are so small that they might as well not exist. In fact, if someone were rolling d4+d8+d10 and simply giving you the results, you would need to record about 7,000 rolls before you could be confident that they weren’t rolling 2d8+d6!
When To Use This Substitute
A first for this 2-part article: I wouldn’t. I don’t see any point of difference significant enough to warrant it.
Here’s another way to look at the number offered in the previous section: let’s assume that the average player makes 20 die rolls in a gaming session. Let’s assume that you play once a week. Let’s assume that you game for 50 weeks a year. And let’s assume that 1/4 of the die rolls you make are either 2d8+d6 or d4+d8+d10. How long to get to that 7,000-roll target where it would be certain that there was a difference between the two?
20 x 50 x 1/4 = number of affected rolls in a gaming year = 250.
7,000 / 250 = number of years before there is a statistically-significant difference = 28 years.
Say no more, really.
Okay, that gets the only slightly-strange choices out of the way. Next week, in Part 3, the really strange stuff and the wrap-up.

Discover more from Campaign Mastery
Subscribe to get the latest posts sent to your email.
Comments Off on Traits of Exotic d20 Substitutes pt 2: The Slightly Strange


