I hadn’t intended to publish another math-heavy article so soon, but when the muse strikes you have to follow it…
To be a top-class GM, you need to have an almost instinctive understanding of probability.
Such understanding rarely comes naturally; you have to work at it, exploring different ways of looking at odds and outcomes. These build up into an experience bank that forms the foundations of an instinctive awareness of the subject.
Counter-intuitive Probabilities
This is made far more difficult by the fact that an incomplete understanding of probability – or a poorly-applied understanding – leads to intuitive results that are wrong. For example, imagine a game show. Let’s say that there are three cards – one that wins something valuable, and two that yield nothing. You, as the contestant, are then required to choose one of the cards.
The host then turns one of the cards that you didn’t choose around, revealing that it’s one of the ‘no prize’ card, and offers you the choice of staying with your original choice or changing to the other unrevealed card.
Should you change or not?
Those with a deficient understanding of probability would say that it makes no difference, the chance is still one-in-three that you made the right choice. Those that think this way are then impacted by a confirmation bias that makes it almost certain that they will stay with their first choice.
But the reality is that by swapping to the other unrevealed card, they double their chances of winning. You see, there was originally a 2-in-3 chance that the card they chose was the wrong one – and once one of the two remaining cards is eliminated, that means that there is now a 2-in-3 chance that the unrevealed card they didn’t choose is the winning card.
Counter-intuitive, right? That’s why it’s sometimes known as the Monty Hall Paradox, or the Monty Hall problem.
The existence of counter-intuitive results when your intuition is giving you a bum steer is a problem that has to be overcome in order to train your intuition properly. It’s often helpful to break situatons down into their simplest form, then introduce refinements.
So let’s do just that.
A simple roll
Almost every roll – be it a saving roll or a skill check or an attack roll – can be expressed by the simple proposition of success or failure.
It’s normal for one of those to be more likely than the other, but that’s a complication beyond a first-cut analysis.
That defines our simplest form as a 50-50 chance, success or failure – or any other contrasting outcome, for that matter, such as high or low.
The simplest die
That defines the simplest die as a d2, also known as a coin, with heads and tails as the outcomes. But actually flipping coins is a noisy and inconvenient process – at least it is if you are trying for true randomness – so I’m actually going to simulate a perfect coin with dice.
This is better than actually tossing dice because there’s always a finite possibility of a real coin landing on it’s edge. With simulated coins, that’s no longer a potential outcome.
The memory of rolls past
If you’ve flipped ten ‘perfect coins’ and they’ve all come up heads, what’s the likelihood that the eleventh flip will also be a head?
The answer is, 50%, the same as always – but even though we know this, intellectually, emotionally we feel that a tail is more likely to occur.
I was thinking about this and wondering what the average length of any string of similar results would be. My suspicion is that it would be the average of the longest possible string (n) and the shortest possible string (1), where (n) is the number of coin-flips – but I don’t have any maths or logic to back up that suspicion, which assumes a linear probability. For all I know, it could be the square root of (n × 1), a decidedly non-linear
So, let’s try and create some.
First flip
The first flip, quite obviously is going to be either a head or a tail.
Second flip
The second flip is also going to be either a head or a tail. That gives four possible combinations of outcomes so far – HH, HT, TH, or TT.
Number of combinations
If we’re talking about ultimately getting to eleven flips, that means that we’re going to have to deal with 2-to-the-11th-power combinations – 48,828,125 of them. There’s no way that’s practical.
This only confirms in my mind that analyzing a simpler set of combinations and extrapolating is the only way to go.
Analysis: two flips
From two flips, we have two outcomes with strings of 2 similar results (HH and TT), and two with dissimilar results (HT and TH). So the average length of result strings is 1.5, exactly what my intuition was suggesting. So far, so good.
Third Flip
This doubles the number of possible results to eight, and for the first time, introduces the possibility of result strings of intermediate length. The eight combinations are HHH, HHT, HTH, HTT, THH, THT, TTH, and TTT. (Double check, counting them up – yep, that’s all eight).
Analysis, three flips
- We have two combinations of length 3 – HHH and TTT.
- We have four combinations of length 2 – HHT, HTT, THH, and TTH.
- That leaves two combinations of length 1 – THT and HTH.
(2 × 3) + (4 × 2) + (2 × 1) = 6+8+2 = 16, so the average length is 16/8=2. Still supporting the instinctive measure – but this suggests something I didn’t expect, our old friend the standard probability curve. It’s too soon to confirm that, but it’s definitely a pattern to watch for.
Fourth flip
With the fourth flip, we’re looking at 16 possible result combinations: HHHH, HHTH, HTHH, HTTH, THHH, THTH, TTHH, TTTH, HHHT, HHTT, HTHT, HTTT, THHT, THTT, TTHT, and TTTT.
I generated that list the easy way: copy the previous list twice, add heads to the first set, and tails to the second set.
Analysis, four flips
- Combinations of length 4: HHHH and TTTT = 2.
- Combinations of length 3: THHH, TTTH, HHHT, and HTTT = 4.
- Combinations of length 2: HHTH, HTHH, HTTH, TTHH, HHTT, THHT, THTT, and TTHT = 8 (actually, I counted seven and thought, that doesn’t seem right – and sure enough, I’d missed one).
- Combinations of length 1: 16-2-4-8=2.
But wait – should TTHH and HHTT count as one or two strings of length 2 results? Answer: only if HTHT and THTH also count as four strings of length 1 results, and HHTH counts as one string of length 2 and two strings of length 1. That could mean that my entire methodology is flawed, because I haven’t been counting the length of strings of results, I’ve been counting combinations that contain a string of results of given length. And that’s not necessarily the same thing at all!
Anyway, lets push on, and then revisit the results using the other, more complicated approach.
(4 × 2) + (3 × 4) + (8 × 2) + (2 × 1) = 8 + 12 + 16 + 2 = 38, and 38/16 = 2.375.
Wait, what?
Not only does this not match up with the instinctive approach expected, it doesn’t look much like a standard distribution, either. There would need to be a second set of outcomes with a result count of 4 somewhere in between length 2 and length 1, and we don’t have one – can’t possibly have one. But it’s possible that this is due to a “rounding error” in the number of length 2 results, in which case, sanity should be restored with an odd number of flips (which would permit something to be in the middle of one and three – in fact, requires something, length 2, to be in between). Until this gets resolved, let’s set aside the length-of-string analysis and go for a fifth flip.
Fifth Flip
32 possible result combinations: HHHHH, HHTHH, HTHHH, HTTHH, THHHH, THTHH, TTHHH, TTTHH, HHHTH, HHTTH, HTHTH, HTTTH, THHTH, THTTH, TTHTH, TTTTH, HHHHT, HHTHT, HTHHT, HTTHT, THHHT, THTHT, TTHHT, TTTHT, HHHTT, HHTTT, HTHTT, HTTTT, THHTT, THTTT, TTHTT, and TTTTT.
That’s starting to get to the point where the results are swimming together and I can no longer visualize the full range of results all at once. You might be more capable than I, but that point will inevitably be reached for most of us eventually.
Analysis, 5 flips
- Combinations of length 5: HHHHH and TTTTT = 2.
- Combinations of lengrh 4:THHHH, TTTTH, HHHHT, and TTTTH = 4.
- Combinations of length 3: HTHHH, TTHHH, TTTHH, HHHTH, HTTTH, THHHT, TTTHT, HHHTT, HHTTT, and THTTT = 10.
- Combinations of length 2: HHTHH, HTTHH, THTHH, HHTTH, THHTH, THTTH, TTHTH, HHTHT, HTHHT, HTTHT, TTHHT, HTHTT, THHTT, and TTHTT = 14.
- Combinations of length 1: HTHTH and THTHT = 2.
Check that I haven’t missed anything: 2+4+10+14+2 = 32.
This is definitely NOT standard distribution.
(5 × 2) + (4 × 4) + (3 × 10) + (2 × 14) + (1 × 2) = 10+16+30+28+2 = 86.
86 / 32 = 2.6875.
Ummm – if there’s a pattern here, I’m not seeing it. I would hope that the increase in the product of results would show something by 86-38=48 and that doesn’t leap out at me as meaning anything. Nor does there seem to be a pattern in the number of results of different length – 2, 4, 10, 14 is not a series that makes sense to me.
The one thing that I can say for certain is that this is NOT “(n +1)/2”.
So much for intuition then. Unless the length of string results yield something more useful, of course.
Let’s go back to the set-aside alternative, then.
Length of string, 1 flip
H or T. That’s two outcomes of length 1. And (2 × 1) / 2 = 1, exactly as you would expect.
Length of string, 2 flips
HH, HT, TH, TT.
- Length 2: HH and TT = 2.
- Length 1: HT and TH = 2 × 2 (one for the H and one for the T in each) = 4.
- Total: (2 × 2) + (1 × 4) = 4+4 = 8;
8/6 = 1.333333….
Hmmm….
Length of string, 3 flips
HHH, HHT, HTH, HTT, THH, THT, TTH, and TTT.
- Length 3: HHH and TTT = 2.
- Length 2: HHT, HTT, THH, and TTH = 4.
- Length 1: there’s 1 in each of the length 2 listings, and 3 in each of HTH and THT, for a total of 4+6=10.
(3 × 2) + (2 × 4) + (1 × 10) = 6+8+10 (now that’s a pattern! But it’s just a coincidence.) = 24
24 / (2+4+10) = 24 / 16 = 1.5.
Hmmm again….
Length of string, 4 flips
HHHH, HHTH, HTHH, HTTH, THHH, THTH, TTHH, TTTH, HHHT, HHTT, HTHT, HTTT, THHT, THTT, TTHT, and TTTT.
- Length 4: HHHH and TTTT = 2.
- Length 3: THHH, TTTH, HHHT, and HTTT = 4.
- Length 2: HHTH, HTHH, HTTH, TTHH (2), HHTT (2), THHT, THTT, and TTHT = 10.
- Length 1: HHTH (2), HTHH (2), HTTH (2), THHH, THTH (4), TTTH, HHHT, HTHT (4), HTTT, THHT (2), THTT (2), and TTHT (2) = 24.
If you aren’t sure of what I’m doing, it might help if I wrote the combinations “HH-T-H” – there are two strings of length 1, so I put a (2) after the combination.
Hmmm: 2 + (1 × 2) = 4; 4 + (2 × 3) = 10; 10 + (3 × 4) = 22. Close, but no banana.
(4 × 2) + (3 × 4) + (2 × 10) + (1 × 24) = 8 + 12 + 20 + 24 = 64
64 / (2+4+10+24) = 64 / 40 = 1.6
I’m not seeing a pattern here, either. I don’t think I need to go to the 5-flip results, I think the point is established.
What point is that? That intuition and probability are not all that compatible!
From these results, I can say that the average is increasing with each flip, but quite slowly, simply because the number of 1-length strings continually outnumbers everything else put together, the number of 2-length strings continually outnumbers everything higher put together, and so on.
A long string of flips
So, let’s used some dice to generate a longer string of flip results and see what we get.
HHHH-T-HH-T-H-TTT-H-TTTTT-HH-TTTTT-H-T-H-TT-HH-TT-H-T-HH-T-HHH-TTTTTT-HHHH-T-H-TT-H-TT
That’s 50, by my count. I’ve inserted a dash every time a string of like results comes to an end. Let’s translate the resilts into a more convenient form- HHHH to H4.- which gives me
H4-T1-H2-T1-H1-T3-H1-T5-H2-T5-H1-T1-H1-T2-H2-T2-H1-T1-H2-T1-H3-T6-H4-T1-H1-T2-H1-T2
The numbers indicate the length of the string of like results, and that means that statistical analysis becomes easy:
- 6-long: 1
- 5-long: 2
- 4-long: 2
- 3-long: 2
- 2-long: 8
- 1 long: 13
1+2+2+2+8+13 = 7+8+13 = 15+13 = 28.
(6 × 1) + (5 × 2) + (4 × 2) + (3 × 2) + (2 × 8) + (1 × 13) =
6 + 10 + 8 + 6 + 16 + 13 = 30 + 29 = 59
59 / 28 = 2.107
That seems completely in line with the results suggested by the smaller analysis. What’s more, it seems to suggest that the increases with each successive flip added to the chain keep getting smaller – if that weren’t the case, the average with this many additional flips would be a lot higher than just 2.1.
By the way, there’s nothing in this analysis to say that improbably results can’t or won’t happen; I’ve seen them happen too many times for that!
Three reels on a poker machine
Let’s take it up a gear. A typical poker machine has three reels, each of which bears symbols representing Ace, King, Queen, Jack, and 10 (symbolized by a zero). There may be others as well; for convenience I will assume that most of these are “null” characters, symbolized by Ø for the purposes of this article.
Let’s assume that there are 4 of each of the main symbols on a single ring, one for each suite. Let’s also assume that there are 11 Ø symbols on each reel and one wild card, which will be symbolized by ☆ in this article. Various combinations give a payout – three of a kind (except three nulls), or two of a kind plus a ☆.
Ring one: AAAAKKKKQQQQJJJJ0000ØØØØØØØØØØØ☆ (probably not in that order).
Ring two: same as ring one.
Ring three: same as rings one and two.
| |
A: |
4 |
| |
K: |
4 |
| |
Q: |
4 |
| |
J: |
4 |
| |
0: |
4 |
| |
Ø: |
11 |
| |
☆: |
1 |
Total, 32 symbols on each reel.
- 21 of these on reel 1 yield a payout if the right things come up on reels 2 and 3. That’s 21/32 = 65.625%.
- Only 5 of the results on reel 2 will match what’s on reel 1 – 5/32 = 15.625%.
- Only 5 of the results on reel 3 will match what’s on reels 1 and 2 = 15.625% again.
Put all of those together, and you get a 1.6% chance of a payout.
Because that tends to frustrate players, various other combinations may be allocated a lesser payout – two of a kind, or a single Ace on any reel. This complicates the chances, but increases them substantially – two of a kind = +8.65% chance of a payout, and any ace = +9.57%. Total = 19.82%.
More reels?
So, let’s contemplate adding 2 more reels. There are two effects: first, the possibility of getting four or even five of a kind now exists, but it’s very improbable, and so you would get a much larger payout. Second, there are now 5 reels and that increases the chances of getting three of them to match, so the chance of success goes up considerably. There are now ways to win with Ø showing on any two of the reels.
How much better? Let’s see:
First, any two reels can be showing Ø so long as the others are right. That means that we can multiply the number of combinations of Ø and non-Ø reels by the chance of one specific configuration to get the total.
| |
ØØCCC |
| |
ØCØCC |
| |
ØCCØC |
| |
ØCCCØ |
| |
CØØCC |
| |
CØCØC |
| |
CØCCØ |
| |
CCØØC |
| |
CCØCØ |
| |
CCCØØ |
A systematic examination of the combinations lists 10 of them. Now, the chances of any one of them: We already know that the first three reels showing CCC has a 1.6% chance of appearing. We need to adjust for the chances of Ø showing up on the other two reels – or, in fact, anything other than the specific matching card symbol. That’s 27/32 for reel 4 and 27/32 for reel 5 – a total chance of 1.139%. But there are 10 of those combinations – so ten lots of 1.139% = 11.39% of getting three of a kind.
Answer: a lot better.
Multiple Lines on a slot machine
Your chances get even better if you can match along different lines. The minimum that I’ve seen in this respect is three lines.
How much better?
At first glance, three times as good. But that ignores the possibility of multiple wins from the same spin – and this is where the exact configuration of each reel becomes a factor as well. On top of that, there is absolutely no reason why the designer needs to follow the rather simplistic pattern that I set up as an example – reel 3 might have fewer aces and more tens, fewer kings and more jacks, fewer queens and more Øs. Do the same across all five reels, and you can see that designers of slot machines have almost total control over the likelihood of any given payout, and can set the house percentage to whatever they think they can get away with.
It’s a fairly default assumption – that a machine is “honest” in the chances that it offers. Design is a totally above-board, totally legal, way of distorting the odds.
So it is with RPGs – GMs have to assume that a player’s dice are “legit”, and players have to assume that the GM’s adjudication, and settings for the chance of success, are fair. If this trust ever breaks down, it almost certainly spells a confrontation, strained relationships, and potentially the end of friendships.
Simulating A Slot Machine
Let’s think about hypothetical approaches to simulating a slot machine with standard RPG dice.
I’ll pick three reels and five lines – three straight across and two at an angle.
The reels we defined earlier had 32 entries per reel, and that doesn’t comfortably fit any standard die. We can get close by externalizing the chance of a null result – eleven of the 32 thus get excluded, leaving 21. Defining a special mechanism for the ‘wild card’ result gets us down to 20, which works.
Instead of the even chances listed earlier, let’s bias things toward the lower end.
| |
A: |
2 |
| |
K: |
2 |
| |
Q: |
3 |
| |
J: |
5 |
| |
0: |
8 |
| |
Ø: |
0* |
| |
☆: |
0* |
or, to put it another (more familiar way:)
| |
01-02 |
A |
| |
03-04 |
K |
| |
05-07 |
Q |
| |
08-12 |
J |
| |
13-20 |
0 |
| |
xx-xx |
Ø |
| |
xx-xx |
☆ |
So, three d20s will give us our middle line. As shown by the “xx-xx” results listed, though, there’s still work to do.
Next, we need a d6:
| |
1-2 |
Ø |
| |
3-6 |
As shown on d20 |
And then we need a wild card mechanism, using the same d6 roll, so let’s replace the above with:
| |
1-2 |
Ø |
| |
3-5 |
As shown on d20 |
| |
6 |
☆ if d20 reads “20”, otherwise as shown on d20 |
This reduces the chances of getting a 10 very minutely, and fills the resulting probability void with a wild card. How minutely? To get ☆, you need a 6 on d6 (1/6) and a 20 on d20 (1/20) – multiply those together and you get 1/120, or a little less than 0.85%.
So, that’s got our main results line sorted. Next, we need a way to simulate the results before and after – above and below – the result showing on the middle line. I could work it with d6s, but to keep the rolls obviously distinct, let’s use d8s instead.
| |
1-4 |
+1 |
| |
5-6 |
+2 |
| |
7 |
+3 |
| |
8 |
+4 |
| |
fresh d20 roll if Ø and +3 or +4 showing; |
| |
☆ if ‘0’ and +4 showing and no ☆ already shown. |
Note that these adjustments are to the indicated results of the d20, not to the roll, so:
- ‘Ø’+1=’Ø’
- ‘0’+1 = ‘J’
- ‘J’+1 = ‘Q’
- ‘Q’+1 = ‘K’
- ‘K’+1 = ‘A’
- ‘A’+1 = ‘0’
- ‘Ø’+2=’Ø’
- ‘0’+2 = ‘Q’
- ‘J’+2 = ‘K’
- ‘Q’+2 = ‘A’
- ‘K’+2 = ‘0’
- ‘A’+2 = ‘J’
- ‘Ø’+3= new d20 roll
- ‘0’+3 = ‘K’
- ‘J’+3 = ‘A’
- ‘Q’+3 = ‘0’
- ‘K’+3 = ‘J’
- ‘A’+3 = ‘Q’
- ‘Ø’+4= new d20 roll
- ‘0’+4 = ☆ if no &star showing on this reel, otherwise ‘A’
- ‘J’+4 = ‘0’
- ‘Q’+4 = ‘J’
- ‘K’+4 = ‘Q’
- ‘A’+4 = ‘K’
The same technique gives us the row of results below the middle row.
Interpreting the results is probably most easily done by actually laying out playing cards in an appropriate 3×3 grid. So, below, we have the results from the die rolls, and below them, an illustration of the resulting ‘display window’ on our simulated poker machine:
| |
d20: |
6, |
14, |
1 |
| |
d6: |
6, |
6, |
2 |
| |
Middle row: |
| |
|
Q |
10 |
Ø |
| |
| |
Row above: |
| |
d8: |
7, |
3, |
8 |
| |
|
Q+3=10 |
10+1=J |
Ø+4=d20; |
| |
|
|
|
Reroll:10 Result: J |
| |
| |
Row below: |
| |
d8: |
3, |
6, |
4 |
| |
|
Q+1=K |
10+2=Q |
Ø+1=Ø |
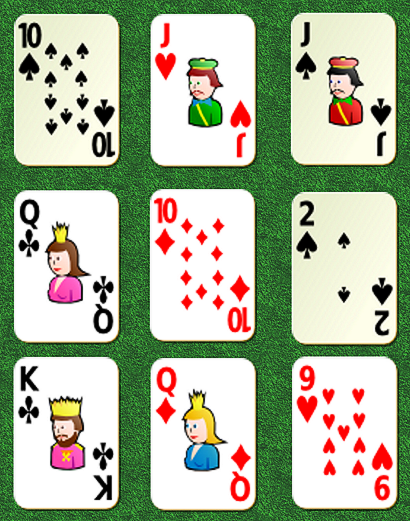
Looking at the result, there are two winning combinations – a pair of Jacks on the top row and a pair of tens on the top-left-to-bottom-right diagonal. So it’s just a matter of knowing how much those particular combinations will pay out.
But my, that’s a lot of palaver!
In Search Of A Simpler Simulation
The big advantage of the approach above is that you don’t need to know the probability of any given result coming up, any sort of reasonable guess will be good enough.
But the simplest dice-based simulation removes that comfort, producing a set of percentile tables that directly spits out not just the paying combination, but every combination of paying combination.
Generating such tables involves a lot of tedious number-crunching. So much so that you might well be tempted to say “bugger this” and simply make up the numbers.
But if you’re going to do that, why not skip the entire act of simulation of results and simply tell the players what the payout is? Using mathematical functions to generate the tables so that the size of a payout is proportionate to it’s improbability, less a house percentage – 5%, 10%, 15%, 20% or even 22 1/2% – is probably going to be quicker and easier.
But what’s the price of that simplicity?
It’s my opinion that this sucks all the excitement out of the process – as does the die rolling simulation given above. And you want the players, and hence their characters, to feel that excitement.
In Search Of A Better Simulation
A far better approach would be to create three suitable decks of cards – one for each reel – shuffle each, and then deal them out, one reel at a time.
Certainly, if such a simulation were needed for an in-game setting, that’s by FAR the better approach.
It also gives you a chance to practice assessing the timing needed to build tension. Done improperly, this has all the impact of wet spaghetti; done perfectly, and the PCs will be sweating on every turn of the cards.
As a learning tool
But I started talking about these things as a tool for GMs to learn to feel probabilities, and none of these methods is perfectly suited to that, for the simple reason that the GM is subconsciously aware of the makeup of each deck (assuming that he uses the most efficient simulation method) and this gives him a leg-up on assessing the probability of results.
The full benefit only comes from something close to the real thing. As a general rule, the best method is playing an online slot machine – preferably a free one, but (having sampled those), they often fall back on the same solution rejected in our simulation discussion, of simply guesstimating the probabilities and leaving it at that.
What’s more, most of them are single-line simulations, which simplifies the problem and reduces the benefits to be obtained.
And that only leaves an online casino, where they spend a huge amount of time and money making the simulations as perfect as possible – a site such as Novibet, for example.
You shouldn’t just play games of this type; you should try to get a sense of the odds that have resulted from all those ways of manipulating the odds that I described earlier as they apply to this particular (virtual) machine.
The objective should be to get familiar enough with probability that you can return to those coin-flips and instinctively know what happens to the average length of results if you alter the odds of a head.
With a coin, that’s virtually impossible short of somehow distorting the shape or the weight of the coin or something. But if the coin is just a metaphor for success or failure of a die roll, this is the sort of assessment that GMs have to be able to make on a regular basis – what happens with a bonus of +1 or a penalty of -1? Or -2?
This is a simple assessment with a linear die roll, like a d20; it becomes more complicated with multiple dice in a compound roll, like 3d6 or 4d8.
A lot of this stuff is intuitive, but there are surprising corners every now and then that are strongly counter-intuitive.
For example, there’s Luck in the Hero System.
Feeling Lucky?
The way this game mechanic works is that a character buys a certain number of dice and then rolls them at the start of each game session. Every ‘6’ that comes up contributes to a level of luck, which can be used by the character’s owner to reshape outcomes and induce improbable events favorable to them. One level of luck is a minor benefit, 2 is a bit more significant, and 3 is almost reality-distorting. All clear? good.
The base Hero System limits the number of dice of luck that you can buy to 3d6, charging a fixed amount for each.
Right away, that seems wonky – the benefits of a third die of luck are far more than the benefits of a second die of luck. In any reasonably-realistic schema, the price of each die would increase dramatically.
But what happens to the chances of successfully rolling 3 levels of luck if you increase the number of dice of luck?
Well, for a while, everything increases more or less as you would expect, and everything is fine. But there comes a point – from memory, 15d6 – at which the probability of three levels of luck overtakes the probability of one or two levels. Or maybe it was 21d6 – the point is, though that it happens.
There’s also the question of what to do if a character with, say, 6d6 in Luck rolls four sixes? Do they get a three-level luck result and a one-level? Or do you define additional reality-altering capabilities that are only accessible with higher levels of luck?
Some readers may be wondering why you would want to permit more than three dice of luck in the first place. The first answer is that comics have long had characters whose power is “super-luck” – there is the DC Villain “Amos Fortune,” who gave the Justice League of America bad luck by stealing their luck for his own use, and there’s “Longshot,” a marvel hero.
Additionally, I found that the “luck” mechanic was a wonderful way of incorporating nuance into all sorts of all-or-nothing game mechanics.
The discovery of the distorted probability situation described above brought an end to that, and the unpredictability, unreliability, and wide range of possible outcomes eventually led to the game mechanism being eliminated from the rules completely in favor of a different system.
It was, in fact, thinking about the ‘luck phenomenon’ that initially started me down the road toward what became The Sixes System.
The Improbability Of Success
Let’s look at an example of a practical benefit from the sort of intuitive understanding that we’re talking about.
What are the chances of success in a task requiring more than one roll? And what if there are modifiers – positive or negative – to some of those rolls, but not all? And what if the roll is to be made on 3d6?
Each of those parameters raises the complexity and difficulty of the problem. The best approach is to simplify it again, then reintroduce the complications one at a time.
First Principles
Let’s start by working out how to proceed using a d20. Because this gives a linear probability of any given result, it makes the problem a lot easier to solve.
When you have multiple rolls, all of which need to succeed, you can get the end probability by multiplying the individual probabilities together.
So, starting with a 10/- needed for success on any individual roll, which is to say a 50% chance of success (yes, I’m aware that some of this is so basic and obvious that it’s blatantly obvious):
- On one roll, the chance of success is 50%.
- On two rolls, the chance of success is 50% of 50%, or 25%.
- On three rolls, the chance of success is 50% of 50% of 50%, or 50% of 25%, which is 12½%.
Applying a positive modifier to one of the rolls increases that individual chance of success.
- For a +1 modifier:
- On one roll, the chance of success is 50%+5% = 55%.
- On two rolls, only one of them modified, the chance of success is 50% of 55%, or 27.5%.
- On three rolls, only one of them modified, the chance of success is 50% of 50% of 55%, or 50% of 27.5%, or 13.75%.
This shows that the power of the +1 is considerably reduced – from +5% chance of success to +1.25%. Unsurprisingly, this is 1/4 of what it was.
- So, how about +2 on two rolls?
- On one roll, +2 translates to +2/20, or +10%. So 50% becomes 60%.
- On two rolls, both at +2, the chance of success is 60% of 60%, which is 36%.
- On three rolls, two of them at +2, the chance of success is 50% of 36%, or 18%.
So the matching +2s don’t yield a +20%, or even a +10%; they increase the chance of success overall by 5.5%. NOT 5%, as might have been suspected.
- And what if there was a -2 on the third roll, in addition?
- Minus 2 translates to -10%, so the chance of success on the third roll becomes 40%.
- Which means that the chance overall is now 40% of 36%, or 14.4%. So, overall, there is an increase of just under 2% from the combination of all these modifiers.
- Which raises the question, what negative modifier would cancel out the net benefit of the two +2s?
- That means that instead of defining the third roll, we are defining the result of the first two (36%) and the net result (12.5%).
- 12.5/36 = 0.3472222222 = 34.72222222%.
- So, starting with a base chance of 50%, a modifier of -15.27777778% is needed.
- ….and that translates to a modifier of -3.055555555.
….which means that it would be reasonably close to the truth to say that +2, twice, is equal to -3.
This demonstrates exactly how counter-intuitive all this can be at first glance.
Next question: what happens with a change in the base chance? What if the base chance was 8/- on d20 and not 10 or less?
- Well, this is exactly the same as applying a -2 modifier to all three rolls.
- Which is to say, the base chance is 40% of 40% of 40%, or 40% of 16%, or 6.4%.
- So that small change has roughly halved the chances of overall success.
- And if we apply +2 to the first two rolls of the set of three?
- Then we are talking about 40% of 50% of 50% – which is the same thing as 50% of 50% of 40%, or 50% of 20%, which is to say, 10%.
- 10% is not very different from the all-50% base result of 12.5%.
- And then apply a -2 to the last of the three rolls?
- Now we’re talking about 50% of 50% of (40-10)%, or 50% of 50% of 30%. Which works out to 7.5%.
- Which is a small improvement on the 6.4%.
- And if we make that -2 a -3, which is what we calculated would just about neutralize the two +2’s?
- So, 50% of 50% of 25% is 6.25%.
- The -3 therefore has overwhelmed the two +2s – not by a lot, but by a sufficient amount that the putative truism determined earlier is no longer accurate, because the 0.15% difference in chance is a far larger margin than the error of -0.055555555% that was unaccounted for.
Another illuminating question might be, how do the two +2s on two rolls of three, compare to a single +4 on a single roll of a set of three?
- The minimum chance of success on a basic d20 roll comes at 1 or less to succeed (or 20 or more, if you prefer; it’s exactly the same thing).
- Chance of success (base) = 5% of 5% of 5%. or 0.0125%.
- +2 on two rolls = 5% of 15% of 15%, or 0.1125%. Which is a substantial increase over the base chance, but doesn’t feel all that generous.
- +4 on one roll = 5% of 5% of 25% = 0.0625%. Pretty close to bang in the middle of the two numbers. Which means that a single +4 appears to be roughly half as effective as two +2s.
- Let’s up the base chances of success to 4 or less.
- Base chance of success = 20% of 20% of 20%, or 0.8%. Still less than 1% net chance, then.
- +2 or two rolls = 30% of 30% of 20%, or 1.8%.
- +4 on one roll = 20% of 20% of 40%, 1.6%.
That’s not close to half-way between the two – it’s very close to the pair of +2s!
- So, let’s up the ante again, to 8 or less base chance.
- Base chance = 40% of 40% of 40%, or 6.4%.
- Two +2’s = 50% of 50% of 40%, or 10%.
- One +4 = 40% of 40% of 60%, or 9.6%.
So the +4 is now even closer to the two +2s, but still mot quite there.
- So, what happens at a 12 or less base chance?
- Base chance = 60% of 60% of 60%, or 21.6%.
- Two +2’s = 70% of 70% of 60%, or 29.4%.
- One +4 = 60% of 60% of 80%, or 28.8%.
Still not quite on parity terms.
- A base chance of 16/-, and we’re running out of maneuvering room.
- Base chance = 80% of 80% of 80% = 51.2%. That’s right, this is how high you need to set the base rolls to end with a roughly 50-50 chance of success overall!
- Two +2s = 90% of 90% of 80% = 64.8%.
- One +4 = 80% of 80% of 100% = 64%.
Strange things happen if we go any higher, because the chance of success is capped at 100%. If your base chance of success is 19 or less, a +2 doesn’t make it 21 or less, the chance can’t go above 20 or less.
That doesn’t mean that a +2 modifier is worthless; it just means that we need to individually track each possible result and then work out the overall chances, a lot more work.
Rather than spend time on that, let’s look at what we can learn from the totality of what’s above.
- Two +2s are always just a little more beneficial than one +4.
- The greater your base chance of success, the greater the impact of bonuses.
- It might be less obvious because I haven’t explicitly calculated any examples, but there is enough information there to show that the same is true of penalties. But this effect tends to get swamped by another factor:
- It takes a ridiculously large base chance to get even a moderate chance of overall success on three rolls. This effect is only exacerbated and amplified by requirements of 4 rolls.
- A base chance of X with a +Y modifier is the same thing as a base chance of X+Y. Yes, I know this is obvious.
- Multiple rolls with a base chance of X and a modifier to one of the rolls of Y yield the same chance of success as the same number of rolls with a base chance of X+Y and a modifier of -Y on all but one roll. Think about that for a moment.
- Lastly, we have now determined a basic technique and employed it often enough that it is almost routine.
One of my players and occasional contributors applied this principle of point 1 to D&D and started asking his GMs for +1 items instead of +2, +3, or even +4 items. The latter requests frequently fell on dead and uncooperative ears, while the smaller requests were more often granted.
So, how many +1s does it take to equal a +4?
Take the log of both sides:
Rearrange to get n on one side of the equality:
so:
| |
x = 1, n = 2.32 |
| |
x = 2, n = 1.63 |
| |
x = 3, n = 1.4 |
| |
x = 4, n = 1.29 |
| |
x = 5, n = 1.23 |
| |
x = 6, n = 1.18 |
| |
x = 7, n = 1.15 |
| |
x = 8, n = 1.13 |
| |
x = 9, n = 1.11 |
| |
x = 10, n = 1.1 |
| |
x = 11, n = 1.09 |
| |
x = 12, n = 1.08 |
| |
x = 13, n = 1.07 |
| |
x = 14, n = 1.07 |
| |
x = 15, n = 1.06 |
| |
x = 16, n = 1.06 |
If we’re talking D&D combat, then X would be your required roll or less to overcome a particular armor class – or, more accurately, twenty minus the required roll or more to overcome that armor class.
So the answer to the question is inherently variable depending on factors not specified. What is beyond doubt is that the number is a lot smaller than most people would expect.
Another way of looking at the above table is to assume that × basically tracks upward with character level, and that as a general rule of thumb two synergizing +1s are more powerful than a +4 item.
I was discussing this online with someone the other day, and they suggested that a different reality could be perceived by assuming that n has to be multiplied by 4, in this case (because we’re comparing with a +4 item)..
His suggestion was that the results would be an estimate of the synergistic total benefit of four +1’s vs a single +4 given that at higher class levels, natural capability increases would tend to be more significant than bonuses. I can kind of see what he was getting at, but I’m not convinced by his formulation.
What can be said for certain is that four +1s at a low character level are far more likely to be granted than a single +4.
Going to 3d6
So, let’s get a bit messier. With 3d6, not all results are created equally, in terms of probability of result.
If you convert those likelihoods of result to percentages, you get:
| |
3 |
|
0.46% |
|
11 |
62.5% |
| |
4 |
|
1.85% |
|
12 |
74.07% |
| |
5 |
|
4.63% |
|
13 |
83.8% |
| |
6 |
|
9.26% |
|
14 |
90.74% |
| |
7 |
|
16.2% |
|
15 |
95.37% |
| |
8 |
|
25.93% |
|
16 |
98.15% |
| |
9 |
|
37.5% |
|
17 |
99.54% |
| |
10 |
|
50% |
|
18 |
100% |
So, let’s put together another suite of results, comparing two +2s with one +4.
- Start with the minimum possible result, 3/- (three or less) chance of success.
- 3/- = 0.46%, so base chance on three rolls is 0.0046 × 0.0046 × 0.46%, or 0.000 009 733 6% – so that will happen once in 10,273,691-and-a-fraction attempts. It’s as close to impossible as you can get.
- +2 on 2 rolls makes them 5/-, which is 4.63%. So the overall chance of success becomes 0.0463 × 0.0463 × 0.46% = 0.000 986 097 4%. That’s 101.3 times more likely than the base level but the chances of success are still only one in 101,410, so confidence would be a bit premature.
- +4 on one roll makes it 7/-, which is 16.2%. Right away, I can see that this will be (16.2 / 0.46) times as likely as the base level, or 35.2 times. Better, but still not great. The actual chance is 0.0046 × 0.0046 × 16.2 = 0.000 342 792%, or a 1 in 291,722 chance. Clearly, base level is a heavily-dominant factor, at least when it’s low.
- let’s try 5/- base chance. This is still very low compared to a typical roll in any 3d6 system, it should be noted.
- We already know that 5/- is 4.63%, so the base chance is 4.63% × 4.63% × 4.63%, or 0.009 925 284 7%, or 1 in 10,075.3 chance. Still not very likely to happen, you will not be surprised to observe. What is more startling is the comparison with the 3/- base level – this is 1019.7 times more likely to succeed, a huge ramping up of the probability.
- +2 to 5/- gives 7/-, which we already know is 16.2%. So two +2s gives an overall success chance of 16.2% × 16.2% × 4.63%, which calculates out to 0.121 509 72%, or 1 in 823 attempts. Still the longest of long-shots, in my book.
- +4 to one roll gives 9/-, which is 37.5%, so the base level here is 4.63% × 4.63% × 37.5%, or 0.080 388 375%, the equivalent of 1 in 1,244. Two +2s still yields a much better chance of success.
- At 7/-, things should start to get interesting.
- 7/- is 16.2%; base chance = 16.2% × 16.2% × 16.2%, or 0.425 152 8%, equivalent to about 1 in 235.
- +2 is 9/-, which is 37.5%. So two +2s = 37.5% × 37.5% × 16.2%, which equals 2.278 125%, or a 1 in 44 chance.
- +4 is 11/-, which is past the peak of the probability curve, at 62.5%. So the chance of success would be 0.625 × 0.162 × 16.2 = 1.640 25% – so the +4 gives a success chance of 1 in 61.
- At 9/-, the base roll is just before the probability peak, while both +2 and +4 modifiers push the chance beyond that peak.
- 9/- = 37.5%, so 37.5% of 37.5% of 37.5% = base chance of 5.273 437 5 – ever-so-slightly better than a 1 in 20 chance.
- +2 = 11/- = 62.5%, so two +2s gives a chance of .625 × .625 × 37.5 = 14.648 437 5%, almost 3 in 20.
- Base +4 = 13/- = 83.8%, so this would yield a chance of success overall of 37.5% × 37.54% × 83.8% = 11.784 375%, more than 2 in 20. The margins between the +4 and the two +2s are shrinking, but two +2s still outweighs a single +4.
- At 11/-, the base roll is past the hump. From now on, the base chance should rocket up.
- 11/- on three rolls is a not at all uncommon in real gameplay, so this is an important result. We already know that 11/- = 62.5%, so the base chance of three rolls = 62.5% of 62.5% of 62.5%, or 24.414 062 5%.- just shy of a 25% chance.
- 11/- +2 is 13/-, or 83.8%, as noted above. Two +2s therefore give an overall chance of 83.8% of 83.8% of 62.5%, which equals 43.890 25% – quite close to a 9-in-20 chance. Arguably, this is a threshold, above which you could begin to feel reasonably confident.
- 11/- +4 = 15/-, or 95.37%, so a single +4 gives a net chance of 62.5% of 62.5% of 95.37%, or 37.253 906 25%, just under 7½ out of 20. Once again, the higher the base roll gets, the smaller the gap between the two +2s and a single +4.
- 13/- is the last result (going up by pairs) before chance calculations start hitting the cap of 18/- (100%). It also means that our individual-roll probabilities are no longer rising as quickly, so this is going to be getting close to the best result, the point at which further improvements in base chance have (comparatively) little impact.
- Base chance, 1 roll at 13/-, = 83.8%; so the net chance on three rolls = 83.8% × 83.8% × 83.8% = 58.848 047 2%. So that additional +2 to the base roll more than doubles the net chance over three rolls!
- 13/- +2 = 15/-, which is 95.37%, so two rolls out of 3 at +2 gives an effective chance of 95.37% of 95.37% of 83.8%, or 76.219 761 222%, or better than a 15-in-20 chance. Perhaps it would be more illuminating, though, to compare it to a single 3d6 roll – this chance is just a little better than 12/- on 3d6, which means that the net effect of the two additional rolls at +2 is essentially a -1 modifier on a single 3d6 die roll – at least at this base chance.
- 13/- +4 = 17/-, which is 99.54%, or a virtual certainty. Does this mean that you can’t roll box cars on 3d6? Absolutely not, in fact you would expect such a result once every 216 rolls, on average. The net chance is therefore going to be a teeny-tiny whisker under 83.8% of 83.8%; when you do the math, you get 69.901 367 76%. For convenience, use 70%. Again, translating this to a single 3d6 roll is quite instructive – it comes out to a bit below 12/-, call it a ‘theoretical’ 11.7 or 11.8, on 3d6. The two +2s gave us a translated result of about 12.5 on 3d6 – so the difference between the two is is really marginal, in fact it’s within the practical rounding error of using a 3d6 scale!
- 15/- starts to give us problems with the +4 modifier, because there’s no such thing as 19/- on 3d6. But the two +2s and base.result should still be illuminating:
- Base chance at 15/- = 95.37%, so the net chance over three rolls is 95.37%^3, or 100 × 0.9537^3 – which is just another way of writing the usual expression. To the mathematician, this is a more elegant phraseology, and somehow feels more accurate (though it isn’t); to a practical mathematician, an arithmetician, it’s easier to grasp 95.37% of 95.37% of 95.37%. In either case, you end up with a result of 86.743 181 715 3%; note that, as predicted, growth in the base chance has started to slow.
- 17/- is equivalent to a 99.54% chance as already observed; so two +2s gives a net chance of 99.54% × 99.54% × 95.37%; I predict a value in the low-to-mid 90s even before reaching for my calculator app! After doing so, the result of 94.494 614 029 2% seems right on expectations.
- simply to demonstrate the addition to the toolkit, let’s look at the +4 answer.
- The other two rolls give a combined chance of success of 95.37% of 95.37%, or 90.954 369%. That’s the easy part.
- That means that whatever the chances of success are on the last 3d6 roll, the net chance of success will be 90.95% of it.
- At first glance: Rolling anything more than 11 is an automatic failure. Rolling 10 or better, with the +4, succeeds. This first glance is incorrect; this is applying the +4 the wrong way around, as though it were a penalty, reducing the chances of success.
- In fact, anything less than 15 rolled will succeed even without the +4. Rolling a 16 succeeds only because of the +4, and the same is true of rolling 17 or 18. So it doesn’t matter What we (hypothetically) roll, we succeed. That’s what +4 means on a base 15/- chance.
- So the final probability of success is 90.95%.
- A couple of special cases are worth examining, using a nice middle of the road base chance of 11/-. The first of these compares a +2 / -2 modifier combination with the established values.
- Base chance, from above: 24.414 062 5%
- Two +2’s, from above (for comparison purposes): 43.890 25%
- One +4, from above (for comparison purposes): 37.253 906 25%
- 11/-+2 = 13/- = 83.8%; 11/- (base) = 62.5%; 11/- -2 = 9/- = 37.5%.
- Calculation: 83.8% of 62.5% of 37.5% = 19.640 625%.
- Same base roll (permitting the same results for comparison), Two +2s and one -1:
- 11/- -1 = 10/- = 50%.
- Calculation: 83.8% × 83.8% × 50% = 35.1122%. This is very close to a single +4 – at this base roll.
- Same base roll, for the same reasons; Two +3s and one -2:
- 11/- +3 = 14/- = 90.74%; 11/- -2 = 9/- = 37.5%.
- Calculation: 90.74% × 90.74% × 37.5% = 30.876 553 5%. Despite seeming more generous in doling out the bonuses, this is actually a harder combination than Two +2s and one -1.
- To understand why, you need to look at the individual rolls relative to the probability peak – the 14’s are well past the peak, but (obviously) below the 100% mark, but the base roll is below the peak, and the -2 applied to it shifts it to well below the peak.
- That means that we have two numbers close to, but a little below, 100%, and one that is a long way below 100%; if the first two were 100%, the last would be faithfully extended to cover the whole set of rolls, as things stand, they can only make a bad situation worse. So the “-2” is strongly dominant in the final result.
Binomial, Trinomial, and Quadronomial expansions
This section will make a mathematical analysis of everything that’s going on. If you’re not especially interested in that, you can skip it (but I don’t recommend doing so) or skim it (a better choice).
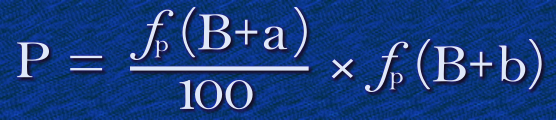
Two rolls can be expressed as a binomial formula:
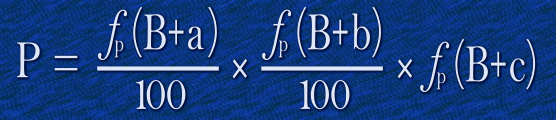
Three rolls can be expressed as a trinomial formula:
…and, unsurprisingly, Four rolls can be expressed as quadrinomial formula:
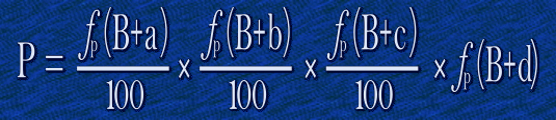
These all use the same nomenclature. P is the net probability of success, B is the base roll, ƒp simply means “convert result to a percentage probability”, and a, b, c, and d are the bonuses / penalties to each roll.
Things get more interesting if you replace the ƒp function with a more complicated but useful structure – ƒ1[B] + ƒ2[a/b/c/d]. To simplify, let’s call the ƒ1 formula “X” and the ƒ2 formula “Y1”,- 2, -3 ,and -4 for a, b, c, and d, respectively. So X defines the base probability and Y the change in that base probability.
In practical terms, Yp(n) has to be calculated with a conversion expression to allow for non-linear rolls:

Formulating the expression in this way means that our binomial expression can be written
| |
P = (x + y1) × (x + y2) / 100 |
or even,
| |
P = x^2 + (y1+y2)•x + (y1•y2) /100 |
The trinomial expansion can be derived in a similar way, first by expanding two of the terms and then expanding the combination with the third:
| |
100^2•P= [x + y1] • [x^2 + (y2+y3)•x + (y2•y3)] |
| |
= x • [x^2 + (y2+y3)•x + (y2•y3)] + y1 • [x^2 + (y2+y3)•x + (y2•y3)] |
| |
= x^3 + (y2+y3)•x^2 + (y2•y3)•x + y1•x^2 + y1•(y2+y3)•x + y1•(y2•y3) |
| |
= x^3 + (y2+y3)•x^2 + y1•x^2 + (y2•y3)•x + y1•(y2+y3)•x + y1•y2•y3 |
| |
= x^3 + (y1+y2+y3)•x^2 + (y1•y2 + y1•y3+ y2•y3)•x + y1•y2•y3 |
Similarly the quadrinomial expression (or expressions describing even longer chains of rolls) can be derived – but I’m not going to bother with that right now; instead, let’s move on.
Think about typical values and what these expressions tell us about those typical values.
For a start, we can say that base values are likely to be somewhere in the 8-15 range. This is true whether we’re talking about 3d6 or d20. Next, we can state that the typical modifiers are going to be around the +2 to -2 range.
That means that x is going to be roughly between 4 times and 8 times any of the y values.
Our binomial expansion makes the significance of that clear: x^2 is going to be between 16 and 64 times as significant as y1•y2, with the bit in the middle somewhere in between.
Similarly, the sequence of significance in the trinomial expansion is going to be:
- The x^3, which is between 64 and 512 times as important as the y1•y2•y3 term;
- The •x^2 term, which is between 16 and 64 times as important as the y1•y2•y3 term;
- The •x term, which is 4-8 times as important as the y1•y2•y3 term.
The exception to this truism occurs when a positive modifier is common to all individual rolls, because these effectively raise the base roll. Plus 1 on every roll is the same as setting B one higher. And the lower the base value of B is, the more significant that increase is.
To put it another way, +2 on 15/- is nice to have but not as significant as +2 on 10/-, or even +2 on 5/-.
And that means that one more comparison is worth making: two +2s vs three +1s vs two +1s and one +2. For simplicity, let’s use a d20 roll.
- Low: Base 5/- =25%; 5/- +1 = 6/- = 30%; 5/- +2 = 7/- = 35%.
- Base chance = 25% × 25% × 25% = 1.5625%.
- Two +2s: 35% × 35% × 25% = 3.0625%.
- Three +1s: 30% × 30% × 30% = 2.7%.
- Two +1s & one +2: 30% × 30% × 35% = 3.15%
- Middle: Base 10/- = 50%; +1 = 11/- = 55%; +2 = 12/- = 60%.
- Base Chance = 50% × 50% × 50% = 12.5%.
- Two +2s: 60% × 60% × 50% = 18%.
- Three +1s: 55% × 55% × 55% = 16.6375%.
- Two +1s & one +2: 55% × 55% × 60% = 18.15%
- High: Base 15/- = 75%; +1 = 16/- = 80%; +2 = 17/- = 85%.
- Base Chance = 75% × 75% × 75% = 42.1875%.
- Two +2s: 85% × 85% × 75% = 54.1875%.
- Three +1s: 80% × 80% × 80% = 51.2%.
- Two +1s & one +2: 80% × 80% × 85% = 54.4%
The important observation here is that three +1s is never quite as good as two +2’s and a base roll, while two +1s & one +2 are even more effective than two +2s and a base roll.
The 9d6 / 3d20 question
The three sets of 3d6 raise the question of comparisons with a single 9d6 roll. The d20 equivalent raises a similar question with respect to a single 3d20 roll.
But we have a LOT of results from preceding sections to compare, so I’m going to make this as minimalist as possible.
To start with, we need the basis of comparisons – statistical analysis of the two sets of rolls, listing the percentage equivalents. For this, I turned to my usual source, Anydice.
I used their service to produce a couple of very pretty graphs, presented below. Unfortunately, to get them to fit the available screen space at Campaign Mastery, they had to be shrunken from the original size, and that has compromised the legibility of the percentages – so I’m going to have to supplement each with a table of the sort already presented.
If you would like to examine the actual graphs as Anydice produces them, I’ll be providing links to those, as well.
First, 3d20:
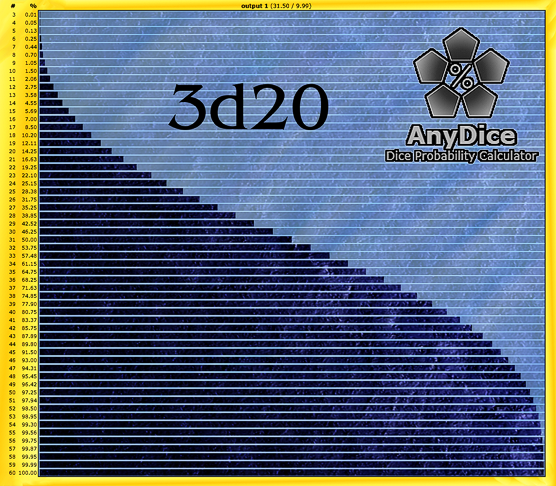
Link to actual results table: Anydice 3d20
Results:
| |
1 |
n/a |
|
16 |
7.00% |
|
31 |
50.00% |
|
46 |
93.00% |
| |
2 |
n/a |
|
17 |
8.50%% |
|
32 |
53.75% |
|
47 |
94.31% |
| |
3 |
0.01% |
|
18 |
10.20% |
|
33 |
61.15% |
|
48 |
95.45% |
| |
4 |
0.05% |
|
19 |
12.11% |
|
34 |
64.75% |
|
49 |
96.42% |
| |
5 |
0.13% |
|
20 |
14.25% |
|
35 |
64.75% |
|
50 |
97.25% |
| |
6 |
0.25% |
|
21 |
16.63% |
|
36 |
68.25% |
|
51 |
97.94% |
| |
7 |
0.44% |
|
22 |
19.25% |
|
37 |
71.63% |
|
52 |
98.50% |
| |
8 |
0.70% |
|
23 |
22.10% |
|
38 |
74.85% |
|
53 |
98.95% |
| |
9 |
1.05% |
|
24 |
25.15% |
|
39 |
77.90% |
|
54 |
99.30% |
| |
10 |
1.50% |
|
25 |
28.38% |
|
40 |
80.75% |
|
55 |
99.56% |
| |
11 |
2.06% |
|
26 |
31.75% |
|
41 |
83.37% |
|
56 |
99.75% |
| |
12 |
2.75% |
|
27 |
35.25% |
|
42 |
85.75% |
|
57 |
99.87% |
| |
13 |
3.58% |
|
28 |
38.85% |
|
43 |
87.89% |
|
58 |
99.95% |
| |
14 |
4.55% |
|
29 |
42.52% |
|
44 |
89.80% |
|
59 |
99.99% |
| |
15 |
5.69% |
|
30 |
46.25% |
|
45 |
91.50% |
|
60 |
100% |
Analysis, multiple d20 rolls vs 1 roll of 3d20:
- 10/- (base) chance d20
- One roll = 50% = 31/- on 3d20
- Two rolls = 25% = 24/- on 3d20
- Three rolls = 12.5% = 19/- on 3d20
- +1, d20
- One roll = 55% = 32/- on 3d20
- Two rolls, one at +1 = 27.5% = 25/- on 3d20
- Three rolls, one at +1 = 13.75% = 20/- on 3d20
- +2, d20
- One roll = 60% = 34/- on 3d20
- Two rolls, both at +2 = 36% = 27/- on 3d20
- Three rolls, two at +2 = 18% = 22/- on 3d20
- Three rolls, two at +2, one at -2 = 14.4% = 20/- on 3d20
- Three rolls, two at +2, one at -3 = 12.6% = 19/- on 3d20
- Three rolls at -2, or base chance 8/- on d20 = 6.4% = 16/- on 3d20
- Three rolls, one at -2 = 10% = 18/- on 3d20
- Three rolls, one at -4 = 7.5% = 16/- on 3d20
- Three rolls, one at -5 = 6.25% = about 15½/- on 3d20
- comparing two +2s on three rolls vs a single +4 on one of three rolls:
- Base roll 1/- = 0.0125% = 3/- on 3d20
- Base roll 1/-, Two +2s = 0.1125% = 5/- on 3d20
- Base roll 1/-, One +4 = 0.0625% = 4/- on 3d20
- Base roll 4/- = 0.8% = 8/- on 3d20
- Base roll 4/-, Two +2s = 1.8% = 11/- on 3d20
- Base roll 4/-, One +4 = 1.6% = 10/- on 3d20
- Base roll 8/- = 6.4% = about 16/- on 3d20
- Base roll 8/-, Two +2s = 10% = 18/- on 3d20
- Base roll 8/-, One +4 = 9.6% = around 17/- on 3d20
- Base roll 12/- = 21.6% = 23/- on 3d20
- Base roll 12/-, Two +2s = 29.4% = about 25½/- on 3d20
- Base roll 12/-, One +4 = 28.8% = 25/- on 3d20
- Base roll 16/- = 51.2% = 31/- on 3d20
- Base roll 16/-, Two +2s = 64.8% = a fraction over 35/- on 3d20
- Base roll 16/-, One +4 = 64% = 35/- on 3d20
- Low: Base 5/-
- Base chance = 1.5625% = 10/- on 3d20
- Two +2s = 3.0625% = 12/- on 3d20
- Three +1s = 2.7% = 12/- on 3d20
- Two +1s & one +2 = 3.15% = 13/- on 3d20
- Middle: Base 10/-
- Base Chance = 12.5% = 19/- on 3d20
- Two +2s = 18% = 22/- on 3d20
- Three +1s = 16.6375% = 21/- on 3d20
- Two +1s & one +2 = 18.15% = 22/- on 3d20
- High: Base 15/-
- Base Chance = 42.1875% = 29/- on 3d20
- Two +2s = 54.1875% = 32/- on 3d20
- Three +1s = 51.2% = 31/- on 3d20
- Two +1s & one +2 = 54.4% = 32/- on 3d20
Next, 9d6:
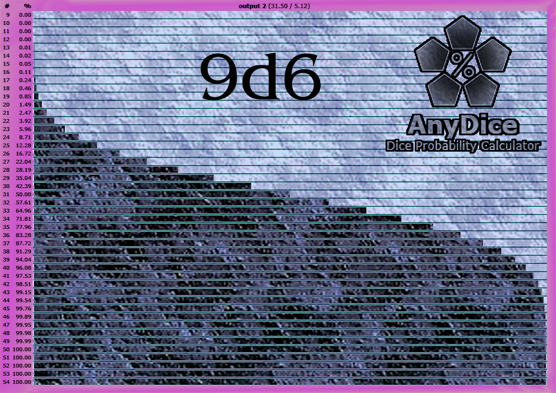
Link to actual results table: Anydice 3d20.
Results:
| |
1 |
n/a |
|
16 |
0.11% |
|
31 |
50.00% |
|
46 |
99.89% |
| |
2 |
n/a |
|
17 |
0.24% |
|
32 |
57.61% |
|
47 |
99.95% |
| |
3 |
n/a |
|
18 |
0.46% |
|
33 |
64.96% |
|
48 |
99.98% |
| |
4 |
n/a |
|
19 |
0.85% |
|
34 |
71.81% |
|
49 |
99.99% |
| |
5 |
n/a |
|
20 |
1.49% |
|
35 |
77.96% |
|
50 |
100% |
| |
6 |
n/a |
|
21 |
2.47% |
|
36 |
83.28% |
|
51 |
100% |
| |
7 |
n/a |
|
22 |
3.92% |
|
37 |
87.72% |
|
52 |
100% |
| |
8 |
n/a |
|
23 |
5.96% |
|
38 |
91.29% |
|
53 |
100% |
| |
9 |
0.00% |
|
24 |
8.71% |
|
39 |
94.04% |
|
54 |
100% |
| |
10 |
0.00% |
|
25 |
12.28% |
|
40 |
96.08% |
|
55 |
n/a |
| |
11 |
0.00% |
|
26 |
16.72% |
|
41 |
97.53% |
|
56 |
n/a |
| |
12 |
0.00% |
|
27 |
22.04% |
|
42 |
98.51% |
|
57 |
n/a |
| |
13 |
0.01% |
|
28 |
28.19% |
|
43 |
99.15% |
|
58 |
n/a |
| |
14 |
0.02% |
|
29 |
35.04% |
|
44 |
99.54% |
|
59 |
n/a |
| |
15 |
0.05% |
|
30 |
42.39% |
|
45 |
99.76% |
|
60 |
n/a |
Notice that rounding error has crept into the table – if the result is less than 0.01%, it has been listed as “0.00%, and if more than 99.99%, as 100%. The probabilities of these results are so low that they might as well not exist. It will only matter on one roll out of 10,000 – or less.
Analysis, multiple 3d6 rolls vs 1 roll of 9d6:
- base roll 3/- = 0.000 009 7336% = 9/- on 9d6
- +2 on 2 rolls, base 3/- = 0.000 986 0974% = 9/- on 9d6
- +4 on 1 roll, base 3/- = 0.000 342 792% = 9/- or maybe 10/- on 9d6
- base roll 5/- = 0.009 925 2847% = 13/- on 9d6
- +2 on 2 rolls, base 5/- = 0.121 509 72% = 16/- on 9d6
- +4 on 1 roll, base 5/- = 0.080 388 375% = about 15½/- on 9d6
- base roll 7/- = 0.425 1528% = 18/- on 9d6
- +2 on 2 rolls, base 7/- = 2.278 125% = 21/- on 9d6
- +4 on 1 roll, base 7/- = 1.640 25% = 20/- on 9d6
- base roll 9/- = 5.273 4375% = 23/- on 9d6
- +2 on 2 rolls, base 9/- = 14.648 4375% = about 25½/- on 9d6
- +4 on 1 roll, base 9/- = 11.754 375% = 25/- on 9d6
- base roll 11/- = 24.414 0625% = 27/- on 9d6
- +2 on 2 rolls, base 11/- = 43.89025% = 30/- on 9d6
- +4 on 1 roll, base 11/- = 37.253 906 25% = 29/- on 9d6
- +2 on 1 roll, -2 on another, base 11/- = 19.640 625% = about 26½/- on 9d6
- +2 on 2 rolls, -1 on a third, base 11/- = 35.1122% = about 29/- on 9d6
- +3 on 2 rolls, -2 on another, base 11/- = 30.876 5535% = about 28/- on 9d6
- base roll 13/- = 58.848 0472% = 32/- on 9d6
- +2 on 2 rolls, base 13/- = 76.219 761 222% = 35/- on 9d6
- +4 on 1 roll, base 13/- = 69.901 367 76% = 34/- on 9d6
- base roll 15/- = 86.743 181 7153% = 37/- on 9d6
- +2 on 2 rolls, base 15/- = 94.494 614 0292% = 39/- on 9d6
- +4 on 1 roll, base 15/- = 90.95% = 38/- on 9d6
Reflections
If you study the results from anydice, it should strike you that the 3d20 rise more gradually and evenly than the 9d6. In a nutshell, the more dice, the faster the attack on the average values and the more remote the extremes of the range.
The shape of Lucky
Dice are at the heart of tabletop RPGs. They are the weapons and instruments of both the Players and the GM. Like any tool, they are more powerful and useful in the hands of an expert who has mastered them tham they are in the hands of an amateur.
Such mastery is not easily come by. I have known people who have gamed for 30 years who couldn’t tell you how the chances of rolling successive successes on 3d6 change with different bonuses.
Every time you think you have a grasp on the subject, remember that +2 × 2 = +3 × 1, and you will find any overconfidence quickly undermined.
Once you have mastered the convoluted shape of Luck, however, you will begin to think of rolls not in terms of their chances of success or failure but as navigational markers through your plotlines.
It’s at that point that you can finally know, almost instinctively, what the chances are, and how you can use that knowledge to everyone’s benefit as GM.


![pi divided by four equals the sum from k=0 to k=infinity of (1 divided by [4k+1]) - (1 divided by [4k+3]).](https://www.campaignmastery.com/blog/wp-content/uploads/2022/08/quick-convergance-1.png)

![Pi = the sum from n=0 to n=infinity of a series, each entry of which is defined as [4 / (8 n + 1)] - [2 / (8 n + 4)] - [1 / (8n+5)] - [1 / (8n+6), the result of which is then multiplied by 1/(16^n). But note the caveat in the text below.](https://www.campaignmastery.com/blog/wp-content/uploads/2022/08/BBP-neater-formulation-from-wolfram-mathworld.png)