Straightening a bent line: Measuring complex distances on a map
Exhaustion has gotten the better of me, I’m afraid, and has prevented me from making enough progress with the next part of the Orcs & Elves series. I always knew it was likely that sooner or later I would run into deadline trouble, and planned accordingly. So here’s an article that I prepared earlier and kept on standby against just such a necessity. I’m also posting it about an hour-and-a-half late because it took a lot longer than usual to get the layout right…
*******************************************************************************************

Measuring distances on a straight line from A to B is relatively simple. You get a ruler, you measure the distance, you measure the scale, divide the first by the second, and hey presto! You have a distance.
*******************************************************************************************
Even somewhat more complex maps consisting of a reasonably limited number of straight segments merely incorporate a simple addition to the problem.
*******************************************************************************************

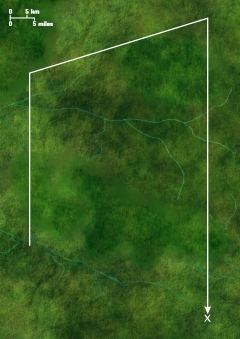
Sometimes, relatively complicated problems can be treated as a straight line and the results will be near enough. The map below right is clearly a very straight line. Given that a the length of this line is more or less 25+ times the length of the scale line, a 0.5mm margin of error in measuring the map scale adds up to 25×0.5=±12.5 mm or more in calculating the total length of the route described by the line, measuring from start-point to end-point. More than a 2 centimeters of error (on the scale of the map) – that’s plenty to swallow the error caused by the “crinkles” in the route. I would be quite happy to guesstimate that journey as being measured length + 2.5cm (I know that it will be longer than the straight-line distance because the route is all slight deviations from that straight line).
What’s more, the usual reason for needing a distance is to convert it into a travel time, and it’s most improbable that any mode of transport other than an aircraft will maintain anything close to an even speed (and, depending on the weather, not even an aircraft might be able to do so). Again, an error source that will more than consume any discrepancy from taking the simple straight-line distance.
*******************************************************************************************
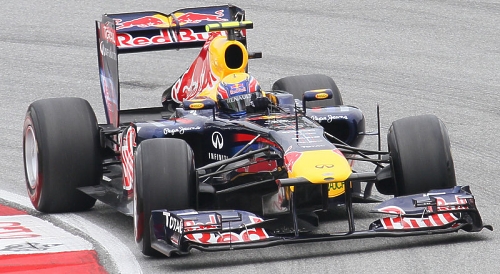
Mark Webber (Red Bull -Renault RB8), 2012 Malaysian GP.
A side-note: people constantly underestimate the impact curves have on average speed.
It is a given that elite racing drivers are sufficiently skilled that they will take corner at the highest possible speed, and will therefore minimize the losses due to cornering in the course of a race.
I should start by saying that although there has been some improvement in absolute top speed (from about 300-310 km/h to almost 345 km/h) in grand prix racing cars over the last 20 years, by far the biggest improvement has come in cornering speeds, with some additional gains in acceleration and braking. On at least 6 occasions in that time, the authorities that control the series have slowed the cars down, by:
- banning electronic driving aids and active suspension;
- banning turbocharged engines;
- banning exotic fuels and exotic fuel additives;
- restricting aerodynamics and wing sizes;
- banning super-sticky, super-fast, “qualifying” tires;
- restricting the width of the tires;
- banning V10s and mandating V8s;
- mandating grooves in the tires;
- restricting the ride height (the height of the cars above ground, which is a key factor in the aerodynamic efficiency of the car underside;
- freezing engine development;
- restricting in-season testing;
- mandating a minimum life for components such as engines and gearboxes; and
- restricting other (more technical) parts of the car design – and that’s a far from complete list.
Without these changes, mostly made on the grounds of safety, the cars at their fastest would be going considerably faster – perhaps 20-25 km/h or more in a straight line, and MUCH much more in corners.
I have chosen four Grand Prix to analyze from the 2012 season because (a) they offer a variety of circuit types, and (b) these particular circuits have not changed very much over the last twenty years, so a rough comparison becomes possible. Fastest speed varies with the aerodynamic set-up of the cars for the circuit and whether or not the straights are long enough for the cars to hit maximum speed. Also, all 8 races analyzed were run in dry weather.
- Monaco Grand Prix: Tight, twisty street circuit, with very short straights. 2012 average race speed: 147.312 km/h. Highest actual speed recorded (in Practice 3, like all these speed values, because those are the only ones that seem to be publicly available): 281.6 km/h. Race speed is only 52.3% of maximum speed. 1992 Average speed: 139.337 km/h. Gain in 20 years: 5.7% speed increase.
- Canadian Grand Prix: Slightly more open circuit with some tight corners and a variety of lengths of straight. 2012 average race speed: 198.028 km/h. Highest actual speed recorded: 324.7 km/h. Average Race speed is 61% of maximum speed. 1992 Average speed: 186.712 km/h. Gain in 20 years: 6%.
- Italian Grand Prix: Fastest circuit on the race calendar; long, open and flowing. 2012 average speed: 231.176 km/h. Highest actual speed recorded: 345.4 km/h. Average Race speed is 66.9% of maximum speed. 1992 Average Speed: 238.855 km/h. Modern cars are only 96.8% as fast as those of 20 years ago – possibly because they take the corners at higher speeds, and hence braking and acceleration gains are minimal and straight-line top speeds haven’t quite caught up with where they were, but more probably due to race circumstances like pit stops. Slight circuit changes also factor in, as do many other influences.
- Japanese Grand Prix: Fast, flowing, long circuit, with many medium-high speed corners. 2012 average speed: 207.632 km/h. Highest actual speed recorded: 309.6 km/h. Race speed is 67.1% of maximum speed. 1992 Average Speed: 183.808 km/h. Gain in 20 years: 13%.
Senna (McLaren-Honda MP4/7A) racing Mansell (Williams-Renault FW14B), Monaco, 1992
So, because of all those changes and restrictions, the cars are (mostly) going only a little faster than they were 20 years ago – and the average race speed is only about two-thirds of maximum speed. Corners that drivers used to have to brake for are now taken absolutely flat to the floor, such as the famous Au Rouge at Spa-Francorshamps.
It can be argued that when discussing ordinary traffic and obedience of the road rules, the losses due to cornering are reduced, because most corners can be taken at the legal speed limit. However, there are so many other causes of delay on a road with traffic that the variability is about the same.
The bottom line therefore, and the point, is that any given trip could reasonably take up to double the time at the posted speed limits, or 50% more than the time at the car’s top speed (if the speed limits are ignored) – even assuming good roads and weather – an error so large that any minor errors in measuring the distance to be travelled is irrelevant. And those are, very definitely, minimum adjustments.


So, a rough-and-ready measuring technique is quite good enough for practical purposes. What’s needed is a technique for doing so when the route to be travelled is a bit more complicated than these relatively simple ones, like the one to the right.
Well, I worked out just such a rough-and-ready technique a long time ago, and this article is going to share it with you, with step-by-step instructions.
Map Prep
Before you can use this technique, there are a couple of things you need to do to your map to prep it.
Step Zero: Print the map of the route
Since this technique leaves marks on the map, its best to work on a printed copy that can be thrown away afterwards.
Step One: Straight Lines
Using straight lines, I’ll then go over the route with a colored pen or texta, as shown:

This should be done fairly quickly. Don’t bother with a ruler, just do the best you can, freehand. Hint: if you move the pen or pencil back-and-forth a couple of times along the line that you want it to follow keeping it just above the page, you’ll get much straighter lines when you lower it that last millimeter or so to the paper.
Of course, since this map is going to be thrown away when we’re finished, why waste a lot of ink on the printing? Make it a light grey and not only will you save money (if your printer is smart enough) but the colored marks we are about to make will show up all the more clearly:

Going The Distance
Next, I’ll prepare the essential tool – a sheet of loose paper, or better yet, an index card, and a sharp pencil or colored pen. 0.5mm markers are perfect for visibility but a pencil mark can be erased and redone.
*******************************************************************************************
Initial Position
Position a left-hand corner of the card at the point where the route whose length is desired starts, as shown:

Pivot The Card
Pivot the card around that point until the edge lines up with the route. Wherever the route deviates from that straight line is the end of the segment that we’re about to measure:

Mark the segment
Starting on the card, put a mark that runs off the edge of the card and onto the map:

Pivot & Mark The Card
That mark becomes the new pivot point on both the map and the card. Rotate the card around that pivot point until it lines up with the next segment of the route and look for wherever the route moves off that line. Put another mark the same way you did the last one:

Pivot & Mark The Card
Once again, the mark you just made becomes the new pivot point. Rotate the card around it until it lines up with the next part of the route and make a third mark – which then becomes your new pivot point, and so on:

End Of One Side
Eventually, you will find that the remaining length of card is not enough to reach the end of a segment of the route. When that happens, extend the last mark you made on the card and put a distinguishing spot or mark on the end of it – I usually use a pennant-shaped triangle:

Then position the next corner of the card at the start of the segment that wouldn’t fit – you’ll know where it is because it’s the last mark on the map – and carry on as before.
End Of The Card
If the route is a long one, you may well reach the end of the card before you reach the end of the route:
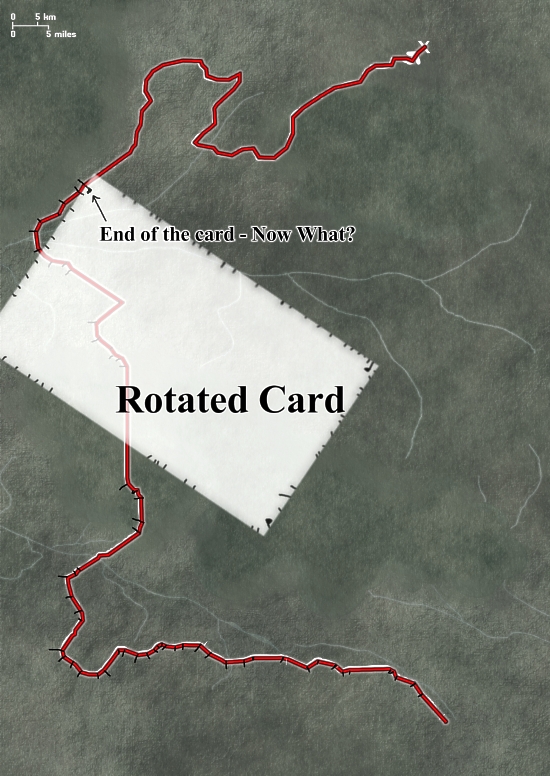
There are two simple solutions to this problem: you can start using the same card sides again with a different color, or simpler yet, just turn the card over and start using the reverse side:

If that’s still not enough, you can do a subtotal, then cut off the edges of the card that has been marked, making a new (smaller) card and go again.
But a single 3″ x 5″ card will usually be more than enough for the most complex route printed on a single sheet of A4 paper – and letter sized pages are slightly smaller again.
Making the measurements
Once you have ‘measured’ the entire route, with all its twists and turns, on the card, it’s time to measure the card. Start in a top left corner and measure across to the first mark:

Write down the result, then move to the next of the measurements:
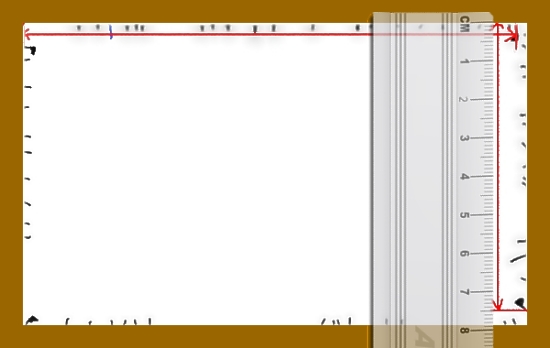
Eventually, you will have measured the entire route:


Conversion
But a distance in millimeters, or in inches and twelfths of an inch, or centimeters, doesn’t help much. Locate the scale on the map, as shown on the right:
*******************************************************************************************
Conversion step 2:
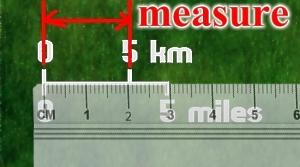
Using the same ruler or other distance-measuring device (so that internal errors remain consistent), measure the scale, as shown to the left:
*******************************************************************************************

Conversion step 3:
Next, note the relative distance that corresponds to the measurement you’ve just made, as shown to the right:
*******************************************************************************************

Conversion step 4:
Next, perform the scale calculation shown above, and hey presto! Instant, reasonably accurate, measurement of the route distance – no matter how complicated the route might be.
*******************************************************************************************
Alternative to scale marks
Some maps don’t offer scale marks, instead stating the scale as a ratio, for example “1:250,000,000”. The trick to using this is to make sure you get your unit conversions right.
If you measure the map in millimeters, multiplying by the conversion rate gives you a number “in the territory” in millimeters – you have to divide by 1000 to get meters, and then divide by 1000 again to get kilometers.
If you measure the map in inches and fractions, multiplying by the conversation rate gives you a number “in the territory” in inches and fractions – you have to divide by 12 to get feet, or 36 to get yards, or 63,360 to get miles.
And, of course, there are 1.6 kilometers in a mile, if you need to make that conversion!
For example, if we measure 28.7cm of route on a map with a scale of 1:250,000, we multiply 28.7 x 250,000 to get 7,175,000cm – divide by 100 to get 71750m, then by 1000 to get 71.75km. Which I would round to 72 km without a second thought.
Accuracy
While errors can accumulate, the more segments you have, the more likely those errors are to average out. That makes this an extraordinarily accurate system – for its simplicity.
Efficiency
I have to admit that it took me most of a day to produce the graphics that you can see here, digitally. The early marks on the card grew fuzzier and fuzzier due to the repeated rotations of the virtual “card”. It’s a lot clearer, and faster, to use the real thing; a complicated route like the one shown might run as long as a whole 5-10 minutes of card twisting and marking.
That makes it one heck of an efficient system – but is the accuracy worth that amount of time investment when you could do something similar with the ruler and about 5 direct measurements plus a guesstimate?
Neat Tricks
The answer is yes, because there are a few really neat tricks that you can do along the way:
Neat Trick: Elevation
Most inclined roads have a gradient of about 1 in 10. A steep one might be one in 5. A really steep one might be one in four. Ordinary vehicles tend to have trouble doing better than 1 in 3, and that with a good road surface – if either of those are untrue, we’re getting into 4WD territory. Even a 4WD will struggle to get up any incline that’s steeper than one in 2.5, or maybe one in 2.
What does that mean? It means that as you mark each segment, you can adjust the length to reflect the incline. For 1 in ten, allow an extra millimeter for every centimeter or so. For 1 in 5, an extra 2 millimeters. For 1 in 4, an extra 2 1/2. For 1 in 3, about 3 1/2. For one in 2.5, an extra 4; and for one in two, 5 mm for every centimeter.
If you’re using inches, 1 1/2 twelfths every inch for 1 in ten; 2 1/2 twelfths for 1 in 5; 3 twelfths for 1 in 4; 4 twelfths for 1 in 3; 5 for 1 in 2.5; and a full half-inch extra for every inch (or so) for 1-in-2.
Neat Trick: Speed Demons
If whatever vehicle is being used is being driven at something close to its top speed with no regard for the road rules, then it will speed up on the downhill sections about half as much as it slows down on the uphill segments. If you know in advance that what you care about is the travel time, and not the distance, you can make allowances appropriately, shortening downhill segments and lengthening uphill ones. For heavy vehicles, the ratio is more likely to be about 1/3.
If, on the other hand, it is being driven to the speed limit, then it’s only on the steeper slopes that the vehicle speed will be affected. Anticipating what you need the measurement for permits you to make the adjustments that are most useful to you.
Neat Trick: Tight Corners
Similarly, if there’s a tight corner, you can lengthen those segments (signifying a slower cornering speed) to take those into account – that’s where that analysis offered in the sidebar earlier comes into its own, in terms of value. If the speed limit is 60, and the fastest you think the corner can be taken is going to be 30, you double the length of the corner segment. It takes a little practice to guesstimate, but with that practice, you can make these adjustments as quickly as you can make marks on the index card.
Neat Trick: Road Conditions
The same technique can also be used to allow for road conditions – rain, fog, snow, whatever. If you want to build in a traffic delay, you can do so – in a far more accurate way than arbitrarily adding time.
The more such additional variables you take into account, the more useful – and accurate – the end result.
Maximum Utility for your efforts
Again, with a bit of practice, you’ll find yourself becoming adept at determining how precise you need to be with your initial straight lines. The more of these little segments you create – and it’s those straight lines that you are measuring with the card – the more accurate the result; the fewer, the faster you can get a result.
As a rule of thumb, segments about the length of the scale marker on the map will be accurate to within 2 x (relative distance divided by speed) in hours.
If the scale is about 1 cm long for 5 km, then 1 cm segments gets an accuracy at 60km/h of 5×2/60 = 1/6 hrs = 12 minutes. Half cm long gets about 6 minutes accuracy. A millimeter long gets an accuracy that’s near enough to a minute.
Same scale at 120 km/h = twice the error. Being able to call a trip of 600-700 km on a complex and convoluted route to within 2 minutes travel time is plenty accurate for most practical needs – and not bad for a 5-10 minute effort.
The typical human eye is good for half a millimeter of accuracy without using a scale or comparison. An artist can often have finer resolution – my vision is accurate to about 1/10th of a millimeter by eye (I can see the difference between marks 0.4 mm apart and those 0.5 mm apart, by eye, and without a ruler). That’s plenty accurate enough to call a travel time of hours down to plus-or-minus 12 seconds if I had to.
Universality
With a little thought (and perhaps some research), you can use this technique with ANY form of locomotion. Horses. Carts. Walking. Motorcycles. Hovercraft. Duck Dodgers on his way to Planet X. Whatever you need.
And that makes it a useful technique to have in your repertoire.

Discover more from Campaign Mastery
Subscribe to get the latest posts sent to your email.


July 2nd, 2013 at 2:44 pm
Why fiddle about with an index card when you can use a piece of string?
July 2nd, 2013 at 5:41 pm
Have you ever tried positioning a piece of string along a twisted line on a map? The “piece of string” solution works whenever you could simply put a ruler or measuring tape on the map, but for anything more complicated it’s a pain.
July 8th, 2013 at 9:52 am
[…] On the Cheap – Be a Player With Little or No Out of Pocket Adventurers Wanted! (Part Four) Straightening a bent line: Measuring complex distances on a map 6 Tips for Making Potions Fun Again mapping dreams Magic Items: You Are Your Stuff [Random […]