Traits of Exotic d20 Substitutes pt 1
There are lots of dice configurations that can substitute for a d20, or sometimes for a 3d6. This 2-part article looks deeply at some.

The image of the balance is by Anna Varsányi from Pixabay. I’ve changed it’s balance and added a load of dice.

I made the time-out logo from two images in combination: The relaxing man photo is by Frauke Riether and the clock face (which was used as inspiration for the text rendering) Image was provided by OpenClipart-Vectors, both sourced from Pixabay.
Not all RPG players and GMs are Geeks, it has to be said, but many of us can spend hours noodling over dice and probability curves and other Geeky dice-related subjects, like “Does my die roll true?” and “Are results more evenly distributed on a die if all opposite sides sum to Maximum + Minimum or can you get high-and-low rollers by clumping results together?”
Well, I’m not going to get into those issues today, but I am going to take a deep dive into d20s and a whole heap of alternatives that might merit consideration from time to time.
In addition to analyzing the bog-standard d20, I have 2 boring alternatives for when you can’t find yours, and 11(+) possible substitutes ranging from the boringly obvious 3d6 through to some quite exotic constructions.
In addition to analyzing and comparing to a vanilla d20 and the obvious 3d6, a number of these rolls merit comparison with each other. Because all that is a LOT of work that I might not get done prior to publishing this article, I’m going to use a lot of headings and subheadings, and indent these, so that you can find and compare the results from one to another for yourself.
This was originally intended to be just one post, but eventually I thought of one exotic die roll too many, and then another (exotic choices #3 and #8, respectively) and was left with no real option. (I’m saving the most interesting alternatives for part 2!)
Index Of Analyses
I wasn’t going to include this, but decided to throw it in at the last minute.
- 4d6: The Methodology Demonstration
- d20: The Yardstick
- Boring Workaround #1: 10 x (d2-1) +d10
- Boring Workaround #2: 5 x (d4-1) + d5
- 3d6: The Standard
- Exotic Choice #1: 2d10
- Exotic Choice #2: d8+d12
- Exotic Choice #3: 2d4+d12
- Exotic Choice #4: 2d6+d8
- Exotic Choice #5: d10+d12
- Exotic Choice #6: 2d8+d6-2
- Exotic Choice #7: d6+d4+d12-2
- Exotic Choice #8: d4 x d6 – d4
- Exotic Choice #9: d30+1-d10
- Exotic Choice #10: 5d4 / d5
- Exotic Choice #11: (3d6+2) / d4
- Exotic Choice #12: (4d10 / 2
Today:
In Part 2:
These choices all derive from thinking about the minimum and maximum results. They are all (with one exception) ways of getting a result from about 1 to about 20, some more effective than others. This article is all about what the differences in probability curves do to the results of using them as a replacement when a d20 or 3d6 roll would normally be called for.
4d6: The Methodology Demonstration
For every roll type to be analyzed, I’ll be presenting a set of probability curves generated by AnyDice.com. This article literally would not be possible in terms of practical delivery without this vital tool.
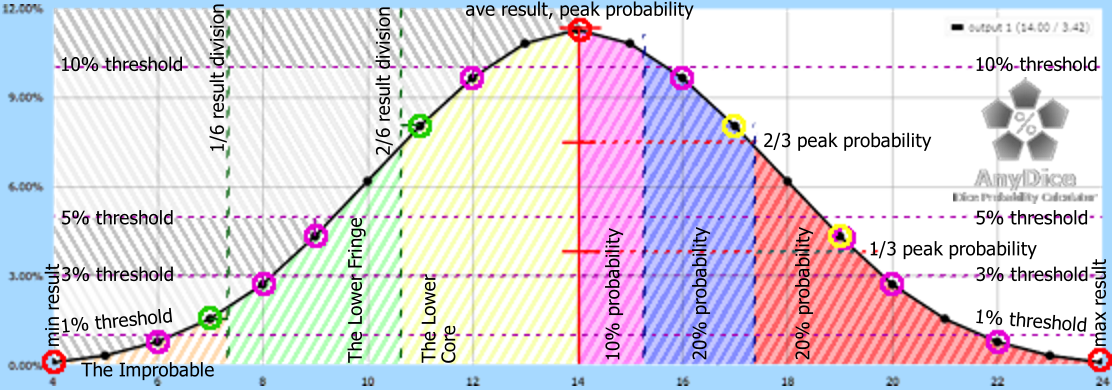
It’s actually possible to display virtually every parameter to be measured on a single graphic, just barely.
But, when I add labels, it gets a little congested and they are very hard to read. So clicking on either of these images will open a 200%-sized version in a new tab that is a LOT clearer.
Let’s run through the content of each analysis. It will start with a graph of the probability curve, just like the ones above (but much simpler, with fewer labels).
Beneath that, I’ll give a verbal summary of what the chart shows. These will be very brief and ignore details.
Those details will be given in an inset text block with a subtitle, as below, and sometimes subdivided into sub-subtitles that are further inset to make them clear. Unlike my normal practice, I WON’T be insetting the titles, only the content under those titles – I think this will help the titles stand out a little more.
Min, Max, Ave
The first set of specifics will be the minimum, maximum, and average result values. These will be compared with the values for a d20 and for 3d6 if relevant (at least one of the two always will be).
The Thresholds
That will be followed with a set of analyses relating to the probability distribution. I’ll use seven of these, between them defining results. It will actually be quite rare for a result to match the distribution parameter precisely; in most cases, I’ll round up (and comment on the fact) but when that distorts the outcome too much, I’ll round down (and again comment).
The probability distribution parameters are mostly defined as “probability thresholds” and the measure that will be given is the result that matches that probability. This will become clearer in a moment!
The 1% Threshold
What’s the first result with a 1% probability of taking place or better? Results lower than this may technically be possible, but to all intents and purposes, they might as well not exist, and those are the results – both low and high – that this test is intended to highlight. On 4d6, 6 or less and 22 or more fall into this classification.
The 3% Threshold
I strongly debated whether or not to include this measurement until I saw the ‘analysis’ of the 4d6 roll used for the explanatory images above. This again covers very low-probability events that are very unlikely to show up unless you roll a lot of times. On 4d6, results of 7, 8, 20, and 21 qualify as falling into this probability band – which means that the results most likely to occur are 9-19.
The 5% Threshold
I was always going to include this category, however, because (by definition) any result on a d20 will be at this threshold. So the results in this band are less likely to show up than on a d20 roll. On 4d6, that’s a 9 and a 19. Which means that on 4d6, 10-18 are more likely to result than on a d20 roll. That’s an important point to note when considering a substitution of 4d6 for a d20.
But another way of looking at these results are defining the results that are realistically as likely or more to occur as on a d20 – so this can be considered the true basis of comparison with a d20. It’s not technically accurate, but for practical purposes, you can actually define a 4d6 roll as giving results of 10-18 with a slight chance of slightly more extreme results. And that’s exactly the sort of comparison that this article is intended to discover and convey.
The 10% Threshold
This selects out only the most likely results. Some rolls may not even reach this threshold. Depending on the probability curves, there may also be a 15% Threshold canvassed in these results. On 4d6, 12 and 16 fall just below this threshold but they are close enough to it that I would (and have) counted them as being in this band of results. So 12-16 are the peak results of 4d6.
What’s most interesting and useful about this metric is the range relative to the previous category, which also includes 10, 11, 17, and 18. That’s four results, while this top category (in this case) includes 12, 13, 14, 15, and 16 – five results. If we exclude the exact average result (14) then – in this case – the peak probability band is the same size in terms of number of results. In cases where the average ends in a decimal place, it wouldn’t be necessary to exclude it or treat it differently, because actual results will always be higher or lower than the average.
Peak Probability
The peak probability is usually but not always the average result. That’s certainly the case when it comes to 4d6, with an average result of 14. That’s four results higher than the average result of a d20 – 11, 12, 13, and 14 are all above the d20 average of 10.5. Four results out of 20 are a full 20% of the possible d20 results, so this is a noteworthy result – but the primary focus of this section of analysis is listing exactly what the probability of the most likely result actually is. In the case of 4d6, that’s 11.27%.
1/3 & 2/3 Peak Probability Results Thresholds
Why is that important? Because it is used to set a second pair of thresholds – one at 1/3 of that peak probability and one at 2/3. This divides the entire range of results into three bands of equal probability, or as close to it as possible.
In the case of 4d6, 1/3 x 11.27% = 3.75667% and 2/3 x 11.27% = 7.51333%.
The 3.75667% threshold falls somewhere in between 8 and 9 on the low side and 19 and 20 on the high. That means that 8 and 20 are outside of it and 9-19 are inside it. Observe that in the case of 4d6, these are the same results given by the 3% threshold – which is not too surprising, there isn’t a lot of difference between 3% and 3.75667%.
The 7.51333% threshold falls in between 10 and 11 on the low side and 17 and 18 on the high. So 11-17 are above this threshold and 9-10 and 18-19 are in the middle bracket but not this one. That’s an important measure of the steepness of the gradient of the probability, I think – we’ll have to see if actual results bear that out. If I’m right, some of the steeper curves – the ones with only two or three dice – will have even fewer results in this classification, while those that are flatter – like 5d6 or 6d6 (neither of which I’m using) – would potentially have more results.
Slices Of Range: Percentages Of Probability
That ends the probability-based analyses and lets me move on to the results-based analyses, where the results are a net total probability. The previous set of results are something of a bridge between the two!
So this section of analysis is all about slicing up the range of possible results and looking at what the probabilities are of that sub-range.
There are two preliminary analyses and then six bands. In mathematical terms, this section is more about the area underneath the probability curve, i.e. the cumulative effect across a range of results. It may or may not yield the same specific transition points as the probability-based analyses in the preceding section.
Range Of Results
First, what’s the total range of results? In the case of 4d6, results run from 4 to 24 – which gives a range of 24-4+1 = 21 results (it’s not 20 because that would exclude the 4, which is [technically] a valid result}).
Compared to a d20: 20-1+1=20 results. Not much difference. In fact you could argue that 4d6-3 is a valid substitute for a d20 – and one that’s not on my list! But since I’m analyzing it anyway, I don’t think there’s any real cause for complaint.
Ave – Min, Max – Ave
With the less exotic die rolls, these should be the same – but it’s not so when some of the more complicated substitutions come under the microscope..
Take 4d6. Average 14, Minimum 4, maximum 24. 14-4=10; 24-14=10. Perfect symmetry around the average.
There’s actually not a lot to see in this section except in the case of those stranger die rolls, but it’s a necessary procedural step to defining the bands of results.
1/3 (Ave-Min) + Min
1/3 of (Ave-Min) + Min defines the lowest 1/6th of the results. In the case of 4d6, 1/3 x 10 + 4 = 3.333 + 4 = 7.333 – so everything below 8 is the lowest one-sixth of possible results.
The “At Most” table from AnyDice translates that, adding up the percentages (even if they are less individually than 0.01) – a total probability of 2.70%.
Previous to 2/3 (Ave-Min) + Min
This defines the second sixth band. In terms of results below average, this is the ‘middle 1/3’.
For 4d6, 2/3 x 10 + 4 = 6.667 + 4 = 10.667. So results of 8-10 fall into this band. The probability of results from 4-10 are 15.90%; subtracting the probability of results 4-7 (calculated in the previous sub-section) of 2.70% gives a result for this band of 13.2%.
It’s the ratio to the low that’s of greatest interest, though – 13.2% / 2.70% is a ratio of 4.889. So the results in this band are almost 5 times as likely to come up.
The Lower Core
The Lower Core is the 1/6th of results below the average from the previous result up. If the average result is an actual possible result, as it is in the case of 4d6, then half of the probability of that average has to be added; the band splits it right in two. Life is simpler when that’s not the case.
Results of 11-13, plus half of 14, give 4d6 probabilities of 44.37 – 15.90 + 1/2 x 11.27 = 28.47+ 8.635 = 34.105%.
Again, it’s the ratios of lesser value that are of greatest interest. 34.105 / 13.2 = x 2.583; and 34.105 / 2.70 = x 12.63. So the low end of maximum probability is more than 2.5 times as likely to result as the middle lower band, and more than 12 1/2 times as likely as the lowest results.
The Upper Core: Average to 1/3 (Max-Ave) + Ave
I’ve given the technical definition above, but in most cases this is more easily calculated from the work already done: the % is 34.105% again, and the values are half of 14 + 15-17, the same width as the Lower Core. Only where a roll’s probability is asymmetric will this not be the easier way of handling this result. There won’t really be a lot to say, for most results, but some of the more exotic options may be interesting.
2/3 (Max-Ave) + Ave
The same goes for this band of results – we already know that it’s 13.2% of the results, and three results wide – so 18-20. Again, things will get more interesting with some of the exotic results.
The Lofty Outcomes
And, the uppermost band of results – for 4d6, that’s 21-24, and 2.70%.
I’ll then wrap up this section by giving a table of the bands and their probabilities. I won’t be doing any fancy formatting, so the columns probably won’t align very well:
4d6:
04-07 = 2.7%
08-10 = 13.2%
11-14 = 34.105%
14-17 = 34.105%
18-20 = 13.2%
21-24 = 2.7%
Slices Of Probability: The Definitive Result Values
That was dividing the results up into six unequal bands. Next, I’ll divide the probability up into 5 equal bands and look at what results are within the probability distribution. I expect these to be a bit of an eye-opener, even with the hints given by the results above.
The Lowest 20%
The cumulative probability of results puts the 20% mark between the results of 10 and 11. So 4-10 are the results in this band.
Second Lowest 20%
We know the lower value result in this band is 11, but where does the cumulative probability cross the 40% mark? The answer, for 4d6, is between 12 and 13. So this entire band is defined as two results – 11 and 12.
The Middle 20%
Using an odd number of bands avoids the complications of the average result sometimes needing to be split. With 4d6, the 60% mark falls between 14 and 15 – so this band is also just two results, 13 and 14.
Second-Highest 20%
The 80% mark with 4d6 lands between 16 and 17 – so, again, 2 results wide, 15 and 16.
Highest 20%
Which, by definition (having excluded everything else), leaves the highest 20% of results containing 17-24. That’s a band 8 results wide, one more than the lowest 20% band.
Peak Probability
We already know this from earlier, but it needs to be recapitulated at this point. The peak probability for 4d6 comes at a result of 14, which has a probability of 11.27%. It’s what I now do with that information that I hope will be informative.
Matching Result: 1/3 Peak Probability
So, at 1/3 of this peak we define two bands, one low and one high. With 4d6, 1/3 of 11.27 = 3.756%. The result with a matching probability doesn’t exist – it’s between 8 and 9 – but using that as a dividing point works. So the bands for 4d6 are 4-8 and 20-24.
I’m honestly not entirely sure whether or not this test will reveal anything significant, but I’d rather include it than risk not doing so.
Matching Result: 2/3 Peak Probability
2/3 of the peak defines another 2 bands, one high and one low, and – by exclusion – a band in the middle. For 4d6, 2/3 x 11.27 = 7.513%. That’s between 10 and 11, and between 17 and 18, so the lower band is 9-10 and the upper is 18-19. The central band is therefore 11-17.
I’ll then wrap up this section of results with a pair of tables, each with 5 bands, summarizing all of the above:
4d6:
00-20%: 4-10
21-40%: 11-12
41-60%: 13-14
61-80%: 14-16
81-100%: 17-24
04 – 08: < 1/3 peak probability
09 – 10: 1/3 – 2/3 peak probability
11 – 17: 2/3 peak probability to peak to 2/3 peak probability
18 – 19: 1/3 – 2/3 peak probability
20 – 24: < 1/3 peak probability
Summary Of Results
A brief verbal summary of the results. I’ll try to highlight the significant bits without getting into recapitulation of specifics. In particular, I’ll want to compare and contrast with a d20.
In the case of 4d6, it’s not an entirely inappropriate substitute for a d20, especially given how low the probability of extreme results is. The fact that the effective range is 7-21. A numeric modifier can shift that towards a more equitable substitution – minus three means that the effective low is 4, the effective high is 17, and the average is 11. There would be a very low probability of 1-3 or 18-21 resulting.
When To Use This Substitute
And then, the real meat: the conclusion. When might this be a useful replacement for a d20? Do the implications of the statistics make it a better fit for skill rolls or attack rolls or saving rolls under certain circumstances?
I’ll also cast a weathered eye (very briefly) over the possibility of substituting the roll when a 3d6 would normally be called for. The same basic questions and options as above.
So, 4d6-3 would be a useful substitute when there is little value in an extreme result – an everyday skill check, for example, or routine training exercise that lacks the real adrenaline ‘punch’ of actual combat. You can reduce that -3 to nuance the odds in the character’s favor, and this would actually represent a significant improvement in the chances of success – useful when there is no serious opposition or difficulty in what the character is trying to do, biasing results in favor of a success.
Substituting 4d6-3 for 3d6 is a more interesting story. There’s a slim chance of a worse result or a better result than is possible on a 3d6 roll, and the average is ever-so-slightly higher. Varying the -3 permits nuanced shading. But the 4d6 roll overall is flatter than a 3d6 roll, so there would be a broader distribution of results and less of a knife-edge. That suggests that this would yield more drama when used in combat or saving throws, if the 3d6 chances were fairly even. if the chances were not even, this would amplify the bias in outcomes – again, more dramatic. I would also be inclined to make this substitution for skill rolls in which there IS significant difficulty or opposition to overcome. In effect, this is the complete opposite of a d20 replacement!
I’ll then conclude the analysis with any other notes that might be of interest – especially comparing one exotic option to another, and any further conclusions that result.
d20: The Yardstick
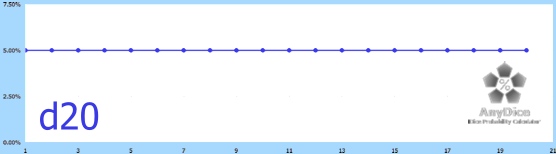
Probably the most boring probability chart ever, matched only by any other single die chart. It is, as you would expect, flat as a pancake from 1 to 20.
Min, Max, Ave
Minimum 1, Maximum 20, Average 10.5.
3d6 has a minimum of 3, a maximum of 18, and an average of 10.5. From which, you might conclude that 19/15 x (3d6-3) +1 would translate a 3d6 roll into a d20 roll. Let’s test that:
Minimum: 19/15 x (3-3) +1 = 1. Correct.
Average: 19/15 x (10.5-3) + 1 = 19/15 x 7.5 +1 = 9.5 + 1 = 10.5. Correct.
Maximum: 19/15 x (18-3) +1 = 19/15 x 15 +1 = 19 + 1 = 20. Correct.
If 3d6 were a flat roll, a single die, that’s “all” there would be to it. But it’s not. You’ll see how much it’s not when I analyze 3d6 as a d20 substitute, a little later. For now, I wanted to present this as a warning against assuming that getting the right minimum, maximum, and average was all there was too it – that’s the beginning of the story, but nothing more.
The Thresholds
Ho-hum. Anyone expecting anything other than an anticlimax needs their head read. Instead, let me relate an anecdote. I once knew a guy who very carefully and meticulously beveled the edges of the “1” face of his d20 on the premise that if the die was teetering on the edge of one of the surrounding faces, this would make it more prone to roll onto the 20. After a little thought, I let him use the die in-game.
Why? First, the converse was also true – if his theory was valid, a potential 20 was just as likely to roll to one of the adjacent sides. And since there were three adjacent faces, this was three times as likely to happen.
Second, by carving away a bit of the dice on one side, he had slightly altered it’s balance so that it was heavier on the side of the 20 – so that would decrease the probability of a 20-or-adjacent, just a little, but probably by more than the increase that he achieved!
In six months of gaming, he never did manage to roll a 20. At that point, he binned it and went back to using an undoctored die. And got a 20 in the first session after he made this change.
A little knowledge can be a dangerous thing…
The 1% Threshold
Never happens, it’s that simple.
The 3% Threshold
Same with this result.
The 5% Threshold
Every possible result meets this threshold. What does that tell us, really?
The 10% Threshold
And, once again, this never happens.
Peak Probability
This is 5%, and it applies to every result. I don’t think I’m telling anyone anything new at this point.
1/3 & 2/3 Peak Probability Results Thresholds
Anyone want to guess which results meet these thresholds? Right, None of them.
Now, maybe things will get a little more interesting, if no less predictable.
Slices Of Range: Percentages Of Probability
Range Of Results
1 to 20. Are we excited yet?
Ave – Min, Max – Ave
1-10 is the low band, 11-20 is the high. No surprises here. Both have a range of 10 results.
1/3 (Ave-Min) + Min
1/3 of 10 is 3.333. So 1-3 is the lowest 1/6th of the results, with a net 15% chance of occurrence.
2/3 (Ave-Min) + Min
2/3 of 10 is 6.667. So 4-6 are the second 1/6th band of results, again with a net 15% chance of occurrence.
The Lower Core
So the lower core therefore has to be 7-10, with a total 20% occurrence. This shows the effects of rounding errors in going from fractional results (that don’t exist in real life) to integer results (which do).
The Upper Core: 1/3 (Max-Ave) + Ave
1/3 x (20-10.5) + 10.5 = 1/3 x 9.5 + 10.5 = 3.167 + 10.5 = 13.667. So 11-13 is the upper core, with a 15% rate of occurrence.
2/3 (Max-Ave) + Ave
2/3 x (20-10.5) + 10.5 = 2/3 x 9.5 + 10.5 = 6.333 + 10.5 = 16.833. So 13-16 is the second-highest band, again with a 15% chance.
The Lofty Outcomes
That leaves 17-20 and a net 20% at the top – again showing the rounding error effect.
d20:
01-03 = 15%
04-06 = 15%
07-10 = 20%
11-13 = 15%
14-16 = 15%
17-20 = 20%
That’s the most even that you can slice 100% into six ‘equal’ chunks with an indivisible unit of 5% at a time.
Slices Of Probability: The Definitive Result Values
The difference between division into 6ths and division into 5ths is a profound one – when it avoids the rounding errors that showed up in the previous tests.
The Lowest 20%
1-4 comprise the lowest 20% of d20 results.
Second Lowest 20%
5-8 are the second lowest 20% band.
The Middle 20%
9-12 are the middle 20% band. Unsurprisingly, these perfectly bracket the average of 10.5.
Second-Highest 20%
Would anyone be surprised by a 13-16 result set?
Highest 20%
And finally, we have a perfectly satisfactory 17-20 as the highest 20% of results.
Peak Probability
This is 5% but we already know that there will be no matching results from this metric. Skipped.
d20:
00-20%: 1-4
21-40%: 5-8
41-60%: 9-12
61-80% 13-16
81-100%: 17-20
Summary Of Results
a d20 has a flat probability curve. Unsurprisingly, it makes a perfect substitute for a d20 roll. But let’s look at subbing in a d20 for a 3d6 roll, just for a moment.
Your average results are a LOT less likely to occur. The chances of extreme results are a LOT higher, at both ends of the scale. The dumbbell-curve of the standard 3d6 roll ‘steals’ probability from extreme results to bolster those middle-of-the-road outcomes.
The reality is that most biological systems and measurements have a dumbbell-shape when you plot them out, all other factors being equal. So the 3d6 roll is a good way of simulating normality, and a d20 is a bad way of doing so.
That’s why D&D uses d6s to generate stats instead of a d20, even though it’s now d20-based in play.
When To Use This Substitute
That doesn’t mean that the d20-for-3d6 substitution is entirely without merit. As soon as non-randomness enters the picture, it can give a better simulation of some outcomes. Five or less on 3d6 represents the lowest 5% chance of success – so for an experiment involving genetic manipulation, you might use d20 instead of 3d6, with the instruction to re-roll any result of 5 or less. This simulates culling the obvious failures and produces a far greater likelihood of successes – exactly what you would expect in such an artificial situation.
That brings me to the two boring workarounds – for when you need a d20 but can’t find one. I wasn’t originally going to include these, but changed my mind when I remembered someone with little grounding in mathematics who absolutely could not be convinced that this was a valid substitution.
Boring Workaround #1: 10 x (d2-1) + d10
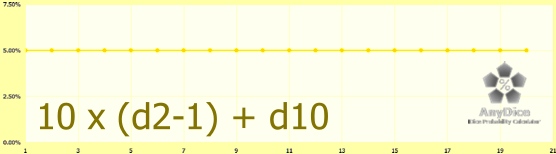
Using a d10 and any dice that gives a high-low result of even probability (don’t try using a d5 or d7) is the standard workaround for occasions when your d20 escapes for a time.
Min, Max, Ave
The high-low tells you whether or not to add 10 to the d10.
The minimum is 1, the maximum is 20, and the average is 10.5 – exactly what you want in a d20.
The Thresholds
These results are exactly the same as for a d20.
Slices Of Range: Percentages Of Probability
Range Of Results
1 to 20, obviously.
Ave – Min, Max – Ave
1-10 and 11-20, both a range of 10 results.
1/3 (Ave-Min) + Min
2/3 (Ave-Min) + Min
The Lower Core
The Upper Core: 1/3 (Max-Ave) + Ave
2/3 (Max-Ave) + Ave
The Lofty Outcomes
These are all exactly the same as a d20. Right down to the rounding error effect.
5 x (d4-1) + d5:
01-03 = 15%
04-06 = 15%
07-10 = 20%
11-13 = 15%
14-16 = 15%
17-20 = 20%
Exactly the same as a d20.
Slices Of Probability: The Definitive Result Values
The Lowest 20%
Second Lowest 20%
The Middle 20%
Second-Highest 20%
Highest 20%
Once again, these are all exactly the same as a d20.
10 x (d2-1) + d10:
00-20%: 1-4
21-40%: 5-8
41-60%: 9-12
61-80% 13-16
81-100%: 17-20
Summary Of Results
There’s a reason why this is the first substitute that comes to mind – it’s the obvious solution to the problem.
There is a question of dice etiquette when someone wants to use this because their d20 is misbehaving, though, because it is more work and that makes it harder to police for cheating. As a general rule, that sort of thing doesn’t bother me, but others may be more sensitive to the issue, so I thought it worth mentioning.
When To Use This Substitute
When you need a d20 and don’t have one to hand – but you do have a d10 and a d-something else.
Boring Workaround #2: 5 x (d4-1) + d5
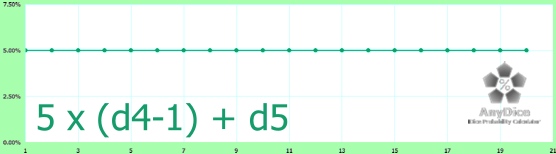
Look familiar? This is a perfect substitute for s d20.
Min, Max, Ave
d4-1 gives results of 0-3. Multiply by 5 to get 0, 5, 10, or 15. Adding a d5 makes each of these 1-5, 6-10, 11-15, and 16-20 respectively.
The minimum is 1, the maximum is 20, and the average is 10.5 – all exactly as they should be.
The Thresholds
As the probability curve above confirms, these results are exactly the same as for a d20.
Slices Of Range: Percentages Of Probability
Range Of Results
1 to 20, as noted earlier.
Ave – Min, Max – Ave
1-10 and 11-20, both a range of 10 results. Perfect.
1/3 (Ave-Min) + Min
2/3 (Ave-Min) + Min
The Lower Core
The Upper Core: 1/3 (Max-Ave) + Ave
2/3 (Max-Ave) + Ave
The Lofty Outcomes
These are all exactly the same as a d20. Right down to the rounding error effect.
5 x (d4-1) + d5:
01-03 = 15%
04-06 = 15%
07-10 = 20%
11-13 = 15%
14-16 = 15%
17-20 = 20%
Exactly the same as a d20.
Slices Of Probability: The Definitive Result Values
The Lowest 20%
Second Lowest 20%
The Middle 20%
Second-Highest 20%
Highest 20%
Once again, these are all exactly the same as a d20.
5 x (d4-1) + d5:
00-20%: 1-4
21-40%: 5-8
41-60%: 9-12
61-80% 13-16
81-100%: 17-20
Summary Of Results
The only real problem with this method is that if you’ve got a d4 and a d10 to use as a d5, there’s a simpler approach – using the d4 (or a d6, more commonly) to get high or low ranges and then a d10 within the range.
When To Use This Substitute
There’s one theoretical occasion when this might be the way to go – when all you have is a d4 and a 6-sided dice. By ignoring sixes on the d6 (re-rolling them) you turn it into a d5 – so the combination is a workaround for when you have neither a d10 nor a d20.
3d6: The Standard
Okay, now we’re getting into more interesting results. 3d6 make a poor substitute for a d20 in strictly mathematical terms – but the resulting probability curve – especially when shifted with a modifier – might be exactly what you need under some circumstances.
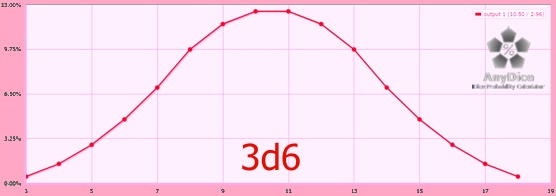
Min, Max, Ave
Minimum: 3
Maximum: 18
Average: 10.5 (this is the characteristic that is most like a d20).
The Thresholds
The 1% Threshold
Only 3 and 18 are below the 1% threshold, though you could argue that at 1.39%, 4 and 17 should be included. I’m not gong to do so. So this threshold is not met by just 1 number from each end of the results.
The 3% Threshold
This falls between 5 and 6 and between 15 and 16 on the other side. Which means that 4 and 5 don’t meet the target on the low side and 16 and 17 on the high – making this 2 results wide on each side. Immediately, there’s a pattern, which is why I stuck to my guns in the previous section – I could see this coming!
The 5% Threshold
Sadly for that pattern, the peak of 3d6 rises so quickly that this target is met between 6 and 7 & 14 and 15. So the band of results which don’t rise to this standard of probability contain just one number from each side of the average – 6 & 15.
The 10% Threshold
8 and 13 almost get there with 9.72% – but rules are rules. And so the pattern continues – One, then Two, then One, and now 2 results again (on each side of the average). 7, 8, 13, and 14 fall below the 10% threshold.
Nothing gets as high as the 15% mark, so that leaves plateau of results as 9-12.
Peak Probability
Both 10 and 11 share this property – 12.50%.
1/3 & 2/3 Peak Probability Results Thresholds
1/3 of 12.5 = 4.1667%, and double that is 8.333%.
The probability band defined by 0-4.1667% almost includes a six and a 15 at 4.63%, but they just sneak into the middle bracket. So 3-5 and 16-18 are in the lowest tier. That’s three results on each side.
Things are a little more clear-cut with the upper limit of that middle tier – 7 and 14 are definitely in the middle group, 8 and 13 are clearly not. so 6-7 and 14-15 hold the middle ground That’s 2 results on each side.
Which defines the high ground as 8-13. And that’s three results on each side again. Those six results occur, according to the statistics, no less than 67.6% of the time – That’s 2 times in 3 and one extra in a blue moon territory!
Slices Of Range: Percentages Of Probability
Range Of Results
3d6 consists of 16 different results. That’s only 80% of the d20’s range.
Ave – Min, Max – Ave
10.5 – 3 = 7.5.
18-10.5 = 7.5.
1/3 (Ave-Min) + Min
7.5 / 3 gives us probability bands that are 2.5 results wide. So the first of these is 3 to 5.5, i.e. 3-to-5. These results have a probability of 4.63%, collectively.
2/3 (Ave-Min) + Min
Adding another 2.5 to 5.5 gives 8. So this band of results runs from 6 to 8, and has 25.93-4.63 = 21.30% of the probability.
That’s a ratio of 4.6, almost exactly. Compare that to the 4d20 ratio of 4.889, and you can see that the 4d6 curve is flatter than the 3d6 (a higher number = a flatter result).
And when you think about it, that makes sense – the more dice you roll, the smaller the difference any one individual high or low result makes. If you were rolling 10d6, and 8 of them came up 3.5 on average (an even mix of 3s and 4s), and those last two were box cars, you have a total result of 28+12=40. That will happen 4.8% of the time – but compared to the average result of 35, it’s only 14.28% higher.
Most of the gain from those box cars is taken up just getting to the average, 7 result increases, leaving just 5 to go beyond the average.
The Lower Core
So the lower core is 9 and 10. Between them, 50 – 25.93 = 24.07% of the probable results will be one of these outcomes, on average.
24.07 is 13% higher than 21.30%. The ratio is 1.1300. That’s a massive difference to the 4d6 ratio of 2.583 – close to half of it, in fact. So the lower core is smaller relative to the results band below it in the case of 3d6 than is the case with 4d6.
The Upper Core: 1/3 (Max-Ave) + Ave
The upper core is the same size as the lower, so the same ratios will apply. It consists of results of 11 and 12.
2/3 (Max-Ave) + Ave
The upper-midband is the same size as the lower midband, 21.30%. It consists of 13, 14 and 15 results.
The Lofty Outcomes
So the upper end of town is 16, 17, and 18 – and these have a total probability of 4.63%.
3d6:
03-05: 4.63%
06-08: 21.3%
09-10: 24.07%
11-12: 24.07%
13-15: 21.3%
16-18: 4.63%
Slices Of Probability: The Definitive Result Values
The Lowest 20%
20% cumulative probability comes between 7 and 8, almost midway between them in fact. So 7 is in but 8 is out, giving a results range of 3-7.
Second Lowest 20%
The 40% threshold is just above 9. This band therefore contains results of 8 and 9.
When you consider the anatomy of a dumbbell curve – flat bottom, inflection point, flat crown of diagnostic width, and a slope connecting the crown to the flat bottom through the inflection point, the fewer the results of this band relative to those above and below, the steeper that slope. In the case of 3d6, it took 5 results to get to 20% and just two to get to 40, indicating a severely sloping upswing in probabilities.
So much so that I would predict, from these results alone, that the inflection point – where the slope of probability changes from more horizontal to more vertical – is at or near 7 or 8, and probably the first.
What do I mean by ‘Definitive?’
Every probability curve has certain attributes that, when quantified, define the shape of that curve. 3d6 is NOT QUITE the same shape as, say, 3d8 and VERY different from, for example, 6d3. The width of the crown, the width of the tails at top and bottom, the location of the inflection point, and the steepness of the slope from inflection point to crown, are such ‘definitive’ attributes. It’s an esoteric area of statistics that only people deeply concerned with quantities of dice being rolled simultaneously and summed – which we do all the time in RPGs – would ever become aware of, let alone analyze.
The Middle 20%
The 60% mark is just short of 11, so we’re still within the crown when we get to this point – or, to put it another way, the crown is wider than this 20% net probability. In fact, this consists of a single result, 10.
Second-Highest 20%
The 80% mark lands about 2/3 of the way between 12 and 13, so this band contains 11 and 12.
Highest 20%
And that leaves 13-18 to encompass the rest.
It’s worth pointing out that despite having a symmetric probability curve and definitively symmetric breakup of probabilities, rounding error has produced asymmetric results – six results in this upper band vs 5 in the lowest 20%.
And, if we were to start at the top and count down by 20%s, we would observe the same pattern – 5 entries in the first band and 6 in the last.
Peak Probability
Two results share the peak probability of 12.50%, balanced on either side of the average result – 10 and 11.
Matching Result: 1/3 Peak Probability
1/3 of 12.5 = 4.1667%. That’s just below 6. So the matching result rounds in this case to the 6, and this band is therefore 3-6, or 4 results wide.
On the upper end, we also get 15-18 within this band.
Matching Result: 2/3 Peak Probability
2/3 of 12.5 = 8.3333%, and that’s so close to midway between 7 and 8 that I can’t – at a glance – tell which way to round. So I’ll have to calculate it.
7: 8.3333% – 6.94% = 1.3933%.
8: 9.72% – 8.3333% = 1.3867%.
So it’s not quite enough to round up to include the 8. That steepness of slope at the inflection point strikes again, with a single result occupying this entire band – a 7, and it’s upper-side counterpart, 14. Is it just a coincidence that both of these are even multiples of the average result of a d6 roll? Despite being able to convincingly fake it, I’m not really an expert in everything – and that’s where my expertise reaches it’s limits.
So, I did what many people these days do in order to fake being better-educated than they are – I asked an AI. It took a bit of conversation back and forth, but eventually we drilled down to the central point: both 7 and 14 are exactly 3.5 away from the 3d6 average. Because of the symmetric nature of the 3d6 probability curve, if you get a 7, you also get a matching 14. It’s that interval to the average that produces the relationship between the average of 1 dice and the results of 7 and 14; the fact that a particular method of selecting intervals led those to be the points chosen is where the coincidence lies, and why there’s no deeper significance to this observation.
That, by definition, gives the crown of the curve, on top of that 2/3 probability line, as 8-13 – a whole six results wide!
3d6:
00-20%: 3-7
21-40%: 8-9
41-60%: 10
61-80%: 11-12
81-100%: 13-18
Notice that it’s in excluding 11 from the central 20% that the rounding error manifests. If 11 were part of the central 20%, then 12-13 would be the second-highest band and 14-18, the highest – and perfect symmetry results.
03-06: < 1/3 peak probability 07: 1/3 - 2/3 peak probability 08-13: 2/3 peak probability to peak to 2/3 peak probability 14: 1/3 - 2/3 peak probability 15-18: < 1/3 peak probability
Summary Of Results
If it were a flat curve, this would be like a d20 with the extremes lopped off at either end. But it’s not a flat curve. There’s a much higher chance of getting an 8-13 result than in a d20 roll, and even 7 and 14 are more likely than on a d20. All that extra probability has to come from somewhere, and in this case, it’s not only come from the lowest and highest range of rolls, but also from those results that are possible on a d20 but not on 3d6, like 1, 2, 19, and 20.
When To Use This Substitute
I need to highlight the impact of modifiers to a 3d6 roll. 3d6+1 and 3d6+2 are significantly different beasts to a straight 3d6 – in comparison to a d20. And the same is true of 3d6-1 and 3d6-2.
Those modifiers apply to every result on the 3d6, shifting it this way or that relative to the average d20 result.
3d6-2: 1 and 2 are now possible results, but the best you can get is now a 16 – and the average is just 8.5.
3d6-1: Results now range from 2 to 17 and the average is down to 9.5.
Straight 3d6: The average result is exactly the same as a d20 but massively more likely to occur.
3d6+1: Only adds 19 to the mix (0.46% chance, a one in 217.4 chance) but takes away 3 as a result, and increases the average to 11.5. So it’s a less extreme modification, one that’s hardly worth making.
3d6+2: You can now get 19 or 20, though they are unlikely (1.8% chance), but 3 and 4 are off the table, and 1 and 2 were never on it to begin with. The average result is now 12.5 – significantly better than the average d20 result.
So use a straight 3d6 when you want to take extreme results off the table and when you want to increase the reliability of getting close to average. This is useful when characters are doing something relatively trivial and mundane, with somewhere close to a 50-50 chance of success.
This can be nuanced with 3d6-1 and 3d6+1 respectively, representing slightly adverse or advantageous situations, or slightly lower or higher chances of success.
When both those factors apply, the effects can be said to compound, or to compensate (depending on the combination). Compensation leads back to the basic 3d6; compounding leads to the more profound 3d6-2 or 3d6+2.
And that’s also true in combat situations (attack rolls and saves), though some of the 4d6 constructions discussed earlier might be even more applicable.
Having both options in your pocket gives further room to nuance and finesse the simulation of reality.
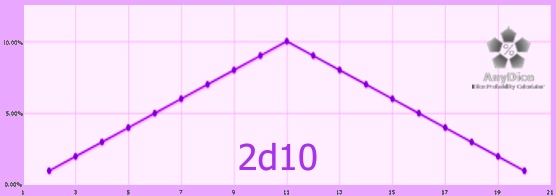
Exotic Choice #1: 2d10
On general principles, I would expect 2d10 to offer a still more nuanced option relative to 3d6, especially in 2d10-1 and 2d10+1 configurations. I will also be interested to see whether 2d10-2 and 2d10-2 yield more or less extreme probabilities than 3d6-2 and +2, respectively. But let’s see what the actual analysis yields!
I’m not sure why, but a lot of people don’t seem to think about 2d10 as a substitute for a d20. It seems a perfectly valid (if perhaps flawed) alternative, to me!
I remember the first time that I realized that two dice – 2d-anything – gave straight lines rising to a point like a triangle; my early education in gaming had told me to expect a dumbbell curve.
A little later, I realized that it WAS in fact a dumbbell curve – just one in which the sides of the curve had been flattened into a perfectly straight line. And the way you can tell this is because 4d-anything won’t give a scaled representation of this straight-lines curve – instead, the dumbbell will manifest as a distortion of those straight lines, a predictable and measurable one – see, for example, the 4d6 analysis earlier; it doesn’t look like this!
Min, Max, Ave
Minimum 2, Maximum 20, Average 11.
So the minimum is a fraction higher, and that lifts the average a fraction higher, too.
In theory, if you did 2d10 – 0.5 and then used a d2 to decide whether or not to round up or down, you might think that you would get a perfect d20 simulation – but it still has the basic 2d10 shape when you plot it out. No matter what you do, it doesn’t quite work – and always has the characteristic 2d10 triangle shown above..
The Thresholds
The 1% Threshold
When you look at the probabilities that go with those positions on the curve, you find that each +1 result increases the probability of that result by a perfect 1% from an initial 1% until you get to the peak probability – and then back down the other side of the triangle. The probability, all the way up to 11, is always (R-1)%.
So 2 and 20 are exactly on the 1% threshold and everything else is above it.
The 3% Threshold
And 4 and 18 are exactly on the 3% threshold, so this contains 3-4 and 18-19.
The 5% Threshold
…and the 5% threshold is reached at 6 and 16, and therefore contains 5-6 and 16-17.
The 10% Threshold
The 10% threshold is met by only the peak probability, which happens to be exactly 10%.
1/3 & 2/3 Peak Probability Results Thresholds
1/3 of 10% us 3.333, and 2/3 is 6.667.
2-4 are therefore below the 1/3 threshold and 5-8 below the 2/3 mark. On the other side of the triangle, it’s 18-20 and 14-17, respectively.
That leaves 9-13 as the upper band with respect to peak probability.
Slices Of Range: Percentages Of Probability
Range Of Results
2-20, or 19 results.
But that lets me bring up a pattern that someone once claimed to see that doesn’t actually exist. Specifically, the claim was that if you had an odd number of results possible, you would get one result at the average that had a higher probability of occurring – the peak of the triangle in this case – and if it was even, then the results would be evenly split on either side of a non-integer average, like 10.5.
Here’s where it comes unstuck: 3d6 had 15 results and no peak point. 1d20 has 20 results and – by definition – no peak point.
I suspect (but haven’t sat down to prove) that the true relationship is not to the number of results but to the number of results PLUS the number of dice IF the latter is greater than 1. Consider:
▪ 2d10: 19+2=21, odd, single peak.
▪ 3d6: 15 + 3 = 18, even, no single peak.
▪ 4d6: 21 + 4 = 25, odd, single peak.
It’s not proof – just an observed pattern.
Ave – Min, Max – Ave
11-2 = 9; 20-11=9.
1/3 (Ave-Min) + Min
1/3 of 9 is 3, and 3+2 = 5. So the bottom 1/3 of lower results are 2-5, and they have a total cumulative probability of 10%.
2/3 (Ave-Min) + Min
2/3 of 9 is 6, and 6+2=8. The middle third of the lower results is thus 6-8, and they contain a cumulative probability of 28-10=18%.
“Wait, what?” I hear someone shout. No, it’s not a perfect x2, which people seem to instinctively expect from the shape and the 10% in the previous result.
1+2+3+4 = 10; that’s why the previous section had a probability total of 10%. 10+5+6+7 = 28, less that initial 10%, and you get 18. Deal with it.
The Lower Core
With a single peak, we again have to split that peak both ways as it ‘stands astride’ the boundary between lower and upper core, one leg in each, as it were.
9-10 is 45-28= 17%, plus 1/2 of 10% = 22%.
“Wait, what?” I hear, again. “How did the missing 2% end up over here?” By not being ‘missing’ in the first place, of course. Neither mathematics nor reality have no need to accommodate simplified human biases toward whole numbers that end in 5 or 0. But it still throws some people for a loop. I even used it in a magic act when I was about 6, making 2% ‘magically’ disappear and reappear, long before I’d ever heard of a d10 – I used a spinner in the act (home-made, of course).
The Upper Core: 1/3 (Max-Ave) + Ave
Therefore, the upper core is 22% and runs from 11 to 13.
2/3 (Max-Ave) + Ave
And the middle upper band is 18% and contains 14-16.
The Lofty Outcomes
Which leaves 17-20 for the top echelon results, and a total probability of 10%.
2d10:
02-05: 10%
06-08: 18%
09-11: 22%
11-13: 22%
14-16: 18%
17-20: 10%
It’s worthwhile comparing the ratios of highest to lowest for this as compared to 3d6 and 4d6.
▪ 2d10: 22 / 10 = 2.2
▪ 3d6: 24.07 / 4.63 = 5.2
▪ 4d6: 34.105% / 2.7% = 12.63
If you think of a dumbbell probability as being a triangle which is pinned part-way up the sides and the upper part is then squashed inwards toward the center to create a sharper rise – that’s inflection point and upper slope to the crown – then this is an indicator of the relative steepness of that slope. With 2d10, it’s not squashed inwards at all; with 3d6, it’s squashed inwards a bit; and with 4d6, it’s squashed inwards a lot.
Slices Of Probability: The Definitive Result Values
The Lowest 20%
The cumulative probability gets to 20% just below 7, so 2-6 are in this band.
Second Lowest 20%
The 40% barrier is almost midway between 9 and 10. So the second lowest 20% contains 7-9.
The Middle 20%
Where would we be without rounding error? Probably a lot less confused about some of this, to be honest. We get to the 60% mark almost midway between 11 and 12, to 10-11 is contained herein.
Second-Highest 20%
The 80% threshold is just above 14, so 12-14 occupy this bracket.
Highest 20%
And the highest 20% of results are therefore going to 15-20.
That’s 6 results wide, compared to the 5-wide of the lowest 20%.
Peak Probability
As already mentioned, result 11 contains the peak probability of 10%.
Matching Result: 1/3 Peak Probability
1/3 of 10% is 3.3333 and that falls between 4 and 5 – but it’s closer to 4.
On the other side of the peak, 18-20 are also in this low-probability domain.
Matching Result: 2/3 Peak Probability
2/3 of 10% is 6.6667 and that’s between 7 & 8, and 14 & 15. But it’s closer to 8 and 14 so they get included in this band.
That means that the top band contains 9-13.
So, in summary: 2d10:
00-20%: 2-6
21-40%: 7-9
41-60%: 10-11
61-80%: 12-14
81-100%: 15-20
02-04: < 1/3 peak probability 05-08: 1/3 - 2/3 peak probability 09-13: 2/3 peak probability to peak to 2/3 peak probability 14-17: 1/3 - 2/3 peak probability 18-20: < 1/3 peak probability
Summary Of Results
When you get right down to it, d10 behaves like a dumbbell curve – it’s just one with unusually flat sides, an even probability increase and decrease up and down the results table.
Some people think that makes it the perfect half-way house between a d20 and a full-on dumbbell curve. I’m not going to buy into that debate on either side.
Ultimately, a native 2d10 roll does two things: it rules out a result of 1, and it makes middle-range results more likely.
It can also be said that extreme results, while still rare (especially in comparison to a d20), are a lot more likely than with greater numbers of dice. Consider:
▪ d20: Minimum 1, probability 5%
▪ 2d10: Minimum 2, probability 1%
▪ 3d6: Minimum 3, probability 0.46%
▪ 4d6: Minimum 4, probability 0.08%
So risk of failure is mitigated but not entirely removed.
When To Use This Substitute
The most significant application of this alternative comes with taking fumbles off the table – if you use fumbles in your game. The price of doing so is making mediocre results more frequent.
That’s the only justification for using this straight-up unmodified substitute, but it’s a powerful one – especially if you give a player the choice: play it safe, or take the risk? Fumbles, in this context, become the price you pay for a better chance of a critical success.
2d10-1 puts fumbles back and takes away the critical success option – but still makes mediocre results more likely than either, and far more likely than a d20 roll. There may be times – especially attempting to perform a task unskilled – where that might be appropriate.
It’s also a useful option to consider when the game system mandates that you need a certain attack bonus to even hit an enemy – because it turns “impossible” into “possible but unlikely”. That can not only be a life-or-death difference to the PCs (or to NPCs if the PCs are decked out with magic gear), it restores an element of player agency that “impossible” takes away. That’s always food for thought.
2d10+1 increases the chances of 20+, which is important if you consider that to be the threshold of a critical success instead of a nat 20. It’s worth noting that the chances of getting 20+ with this construction are still less than with a d20, though. But it takes fumbles completely off the table, emphatically. Nevertheless, I don’t recommend this substitution.
And with 2d10+2, that balance shifts slightly – 6% chance of a 20+ result instead of a d20’s 5%.
Again, the price of these benefits is the increased chance of a mediocre roll, but that also shifts with +1 or +2. With +1, the average result becomes 12, and with +2, it’s 13. Both are significant improvements over the d20 average of 10.5. Psychologically, a 13 average feels a lot more profound than a 12 average, and that’s actually a legacy of having grown up using 3d6.
▪ 3d6: Average 10.5, chance of a 13 or better = 25.93%
▪ 2d10+1: Average 12, chance of 13 or better = 45%
▪ 2d10+2: Average 13, chance of 13 or better = 55%.
A “mediocre” result on 2d10+2 is not a bad result at all. How “not bad” it is depends on the target number to reach – but even if it’s a 14 or a 15, you’ll have about as or better chance –
▪ 14: 36% on 2d10+1, 45% on 2d10+2; 35% on d20.
▪ 15: 28% on 2d10+1, 36% on 2d10+2; 30% on d20.
– with these options than a native d20. So I would also use these alternatives when a player indicates that “near enough is good enough”, as a way of baking that attitude into the outcome of the roll.
Exotic Choice #2: d8+d12
I wasn’t originally going to do 2d10, but I always had this option on my list. It will be interesting to see what differences there are, if any, between this option and that one.
Because I expect that to be of special interest, I’m including the 2d10 chart on this probability chart, and…
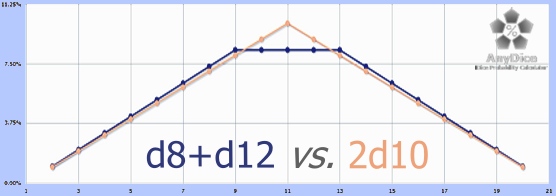
…and WHOA, I was not expecting that! There’s a CLEAR difference between the two, with the top of the triangle lopped off – and has ALL that probability really gone into making the sides just that tiny bit steeper??
Min, Max, Ave
Minimum 2
Maximum 20
Average 11
The Thresholds
The 1% Threshold
2 and 20 are only just above this marker at 1.04%. It’s so close that I’m going to include them anyway.
The 3% Threshold
This falls a little way under 4 and 18, both of which score 3.13% probability. But that’s not close enough in my book, so the 3% threshold is only occupied by 3 and 19.
The 5% Threshold
It’s a little closer to 6 than to 5, but not close enough at 5.21%. The match on the other side is 17. So this band is occupied by 4-5 and 17-18.
The 10% Threshold
No results get here – there are 5 results with an 8.33% probability.
1/3 & 2/3 Peak Probability Results Thresholds
1/3 x 8.33 = 2.7767.
2/3 x 8.33 = 5.5533.
The 1/3 mark is closer to the 4 than the 3, but not close enough. So 2-3 and 19-20 fall into the 1/3 peak probability zone.
The 2/3 mark is above 6, but nowhere near making it to 7; the corresponding high side result is 16. So the middle third contains 4-6 and 16-18.
That leaves the top of the charts as containing 7-15, a whole 9 results or 1 1/2 times the results span of the zone below. Despite having a more aggressive probability rise and fall, this is actually a LOT flatter than 2d10. Part of that is the ‘plateau’ – but that alone isn’t enough to fully account for it; it’s a genuine statistical phenomenon.
Slices Of Range: Percentages Of Probability
Range Of Results
2-20 – which is 19 results wide, the same as 2d10..
Ave – Min, Max – Ave
Ave – Min = 11 – 2 = 9.
Max – Ave = 20 – 11 = 9.
Symmetrical about the average.
1/3 (Ave-Min) + Min
9 / 3 = 3; 3 + 2 = 5. So a result of 5 marks the boundary between these layers. Just as I’ve had to do when the overall average ‘overlaps’ the lower an upper core, that means that 5 has to be treated as half-in and half-out of this results band.
2-4 gives 6.25%. 5 alone is worth 4.17%, so half of that is 2.085; adding that to the 6.25 makes this zone 8.335% tall.
2/3 (Ave-Min) + Min
If 1/3 is 3, then 2/3 must be 6, and 6 + 2 = 8. Once again, a result that is astride two different zones.
6-7 are 21.88 – 10.42 = 11.46%. Half of 5 adds 2.085, and half of 8 = 7.29 / 2 = 3.645. Adding those makes this band of results 17.19% tall, which is a little more than twice the height of the previous zone.
The Lower Core
It’s not particularly surprising to me at this point that the overall average of 11 has to be split between lower and upper core. So the lower core is half of 8, plus 9 & 10, plus half of 11:
3.645 + (45.83 – 29.17) + 8.33 / 2
= 3.645 + 16.66 + 4.165 = 24.47%.
That’s about 1.42 times the lower middle total, and almost 3 times the bottom-most bracket – which, as a ratio, is rather low, and signifies that low results are relatively likely compared with other constructions.
The Upper Core: 1/3 (Max-Ave) + Ave
The set of results above the overall average mirror those below. So the upper core is also 24.47%, effectively creating a single span through the center of the results that comprises almost half of ALL the results.
The upper core is half of 11, plus 12 & 13, plus half of 14.
2/3 (Max-Ave) + Ave
The upper middle band, like the lower middle band, is 17.19% in height, and consists of half of 14, 15 & 16, and half of 17.
The Lofty Outcomes
Which leaves half of 17 plus 18-20 for the top end results, and a probability of 8.335%.
d8+d12:
Lowest Results: 02-05: 8.335%
Lower Middle: 05-08: 17.19%
Lower Core: 08-11: 24.47%
Upper Core: 11-14: 24.47%
Upper Middle: 14-17: 17.19%
Highest Results: 17-20: 8.335%
Slices Of Probability: The Definitive Result Values
The Lowest 20%
7 is almost in the lowest 20%, but the cumulative probability is 21.88% – so just a little too high.
This band is results 2-6. Again, the flatness of the ‘curve’ is apparent from the 5-results span.
Second Lowest 20%
The 40% probability mark is closer to midway between 9 and 10 – it’s about 1/3 of the way up. So 9 is in but 10 is not, making this span, 7-9.
The Middle 20%
Rounding error strikes again!! The 60% total probability mark is between 11 and 12, closer to the higher number but not quite getting there.
So the middle “20%” is 10 & 11.
Second-Highest 20%
The 80% mark is a little above 14. So this band spans results from 12 to 14.
Highest 20%
Which means that ‘rolling high’ with this construction is anything from 15 to 20.
Peak Probability
8.33%, as already noted.
Matching Result: 1/3 Peak Probability
1/3 of 8.33 = 2.7767. That is higher than 3 but lower than 4, so 3 is in and 4 is not. On the high side, 19 and 20 are also in.
Matching Result: 2/3 Peak Probability
2/3 of 8.33 = 5.5533, which is between 6 and 7. So 4-6 are in the middle 1/3 of probabilities, matched by 16-18, and 7-15 are the most probable results.
d8+d12:
00-20%: 2-6
21-40%: 7-9
41-60%: 10-11
61-80%: 12-14
81-100%: 15-20
02-03: < 1/3 peak probability 04-06: 1/3 - 2/3 peak probability 07-15: 2/3 peak probability to peak to 2/3 peak probability 16-18: 1/3 - 2/3 peak probability 19-20: < 1/3 peak probability
Summary Of Results
Extreme results are possible, and even a little more likely than with other constructions – but the difference is so small that few will care. 2 & 3 have a total probability of about 3.1% – any two results like that on a d20 have a 10% chance.
The dominant feature of this construction is that plateau of results, 5 – almost 7 – results wide.
Things get a little more interesting when you compare to a 3d6 roll. Not only are low results a LOT more likely, but they also extend both higher and lower by 1 at the bottom and 2 at the top. there is also far less focus on the average result than on 3d6 – there’s a greater spread across the top of the probability chart. So there is greater uncertainty over the outcome – and a greater potential for near-miss results if the target is close to the average result of 11.
When To Use This Substitute
Over the central plateau, this is a lot like a d20 in that the curve is flat. In fact, the wider spread of mediocre results is more likely to eventuate than on a d20. That makes this an appropriate substitute for a d20 in cases where someone is being taught a skill – there’s a supervisor who will step in (if he can) before things really go pear-shaped, but beyond that, the student lives and dies on the merits of his own effort. This construction simulates this situation very well, with both extremes less likely for different reasons.
Things get a little bit trickier when discussing replacing 3d6 with this roll. Extreme outcomes are both more likely and potentially better, or worse. And yet, the vast majority of times, you will get a result somewhere in the middle. The most appropriate use for this substitution is for the simulation of some poisons and diseases, where some damage is almost certain to take place, and extreme results are possible but unlikely – but potentially better or worse than a 3d6 roll. It might be necessary to scale the results before it can be used this way – dividing by 4 would give a results span of 0 to 5, with 2-3 the most likely to result; dividing by 3 would give a span of 0 to 6, with 2-4 most likely. But I’m not sure that it;s worth the extra trouble. There are other ways that are even more dramatic.
“Like what?”, you ask. Well, imagine a disease or poison that is represented by 4d6 or 5d6. Every time a 1 comes up, the sufferer takes 1, 2, 3, or even 4 points of damage and 1 point of stat loss – for each 1 showing. On a 2, you take half this and no stat loss. When your rolls have accumulated a certain number of 6s, the poison / disease has run it’s course; until then, you roll at regular intervals. If you roll lucky, you get only a passing brush with the disease; if you don’t, it can ravage even the healthiest of bodies. Rolling multiple dice using such a system is inherently dramatic and scary for the players, helping them get into the correct roleplaying mindset.
That said, the d8+d12 option is, at the very least, exotic, and that can be useful in and of itself in such situations. So save this as a 3d6 substitute for when you want to emphasize and punctuate that exotic quality.
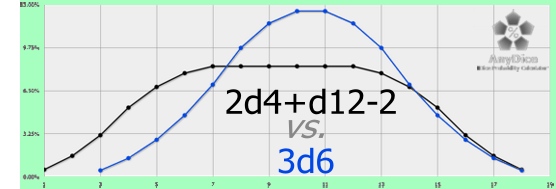
Exotic Choice #3: 2d4+d12
The d8+d12 option soon suggested this three-dice alternative, but I wasn’t 100% sold until I saw how interesting that two-dice was. I have to admit to not being quite sure what the resulting probability curve would look like. The results are perhaps even more interesting than I expected them to be!
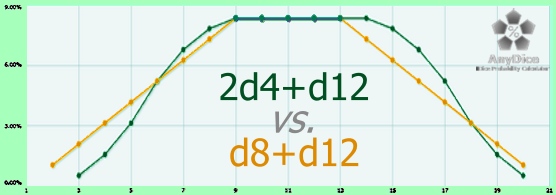
The first thing you notice is the flat top with exactly the same probability as d8+d12. Then you notice the curvature of the walls. Third, you notice that relative to d8+d12, results are biased high.
Let’s get into the details and see what makes this probability tick.
Min, Max, Ave
The minimum is 3, the maximum is 20, and the average is 11.5. The plateau is 6 spaces wide, not 5.
The Thresholds
The 1% Threshold
3 and 20 are below this threshold – for practical purposes, the range is 4-19.
The 3% Threshold
5 and 18 are just above this threshold, so even 4 and 19 are improbable results.
The 5% Threshold
6 and 17 are just above this threshold, so even 5 and 18 are less likely than on a d20 roll.
The 10% Threshold
No results exceed this threshold, so everything from 6-17 are in this band – that’s 12 results!
Peak Probability
This is 8.33%, the same as d8+d12.
1/3 & 2/3 Peak Probability Results Thresholds
1/3 x 8.33 = 2.7767, which falls between the probabilities of 4-5 and 18-19. So the most improbable results are 3-4 and 19-20.
2/3 x 8.33 = 5.5533, which lands between 6 and 7 on the low side and 16 & 17 on the high. So the middle probability range holds 5-6 and 17-18.
That means that the top tier of probability holds all results from 7 to 16, a range of 10 results. Since there’s a total results span of 18, that’s more than half of them!
Slices Of Range: Percentages Of Probability
Range Of Results
18 results range from 3 to 20.
Ave – Min, Max – Ave
11.5 – 3 = 8.5.
20 – 11.5 = 8.5.
So the roll is symmetrical.
1/3 (Ave-Min) + Min
1/3 x 8.5 is 2.8333. So 1/3 of the way through below-average range of results is 2.8333 + 3, or 5.8333.
The bottom range of results is 3-5, which have a total probability of 5.21%.
2/3 (Ave-Min) + Min
2/3 x 8.5 = 5.6667. So 2/3 of the way through the below-average range of results is 5.6667+3 = 8.6667. So the lower-middle sixth contains results 6-8 at a total probability of 25 – 5.21 = 19.79%. Not quite 4x as likely as the lower band.
The Lower Core
That means that the lower core is 9-11, with a total probability of 50 – 25 = 25%. This is only a little over a 25% increase on the previous band, an indicator of the extreme flatness of this probability distribution.
The Upper Core: 1/3 (Max-Ave) + Ave
2.8333 + 11.5 = 14.333, so the upper core ranges from 12 to 14, and represents 75 – 50 or another 25%. The core, in total, is going to come up on half of all rolls.
2/3 (Max-Ave) + Ave
5.6667 + 11.5 = 17.1667, so the middle upper range contains 15-17, with 94.79 – 75 = 19.79% of all rolls falling into this area.
The Lofty Outcomes
And, the top of the range is therefore 18-20, with a total of 5.21% of results – most of which will be 18s.
2d4+d12:
03-05 = 5.21%
06-08 = 19.79%
09-11 = 25%
12-14 = 25%
15-17 = 19.79%
18-20 = 5.21%
Slices Of Probability: The Definitive Result Values
The Lowest 20%
Breaking the 100% total probability of results as evenly as possible into bands of 20% shows 3-7 as being the bottom range. 20% of the time, you’ll roll a number in that range.
Second Lowest 20%
The 40% threshold is just below 10, so results 8 & 9 occupy this space.
The Middle 20%
60% is just over 12. so 10-12 are the middle bracket of possible results.
Second-Highest 20%
The 80% threshold falls just below 15, so the band of results that fall into the 61-80 range are 13-15.
Highest 20%
Which in turn defines ‘rolling high’ with this construction to be any result from 16-20.
Peak Probability
I’ve just realized that I’m already calculating this in a previous section – no wonder I kept getting deja vu. So this sub-section, and the two that have been following it, are redundant. But since they seem more relevant to this area of analysis, it’s the earlier one that’s going to be excised hereafter.
2d4+d12:
00-20%: 3-7
21-40%: 8-9
41-60%: 10-12
61-80%: 13-15
81-100%: 16-20
04-05: < 1/3 peak probability
06-07: 1/3 – 2/3 peak probability
07-16: 2/3 peak probability to peak to 2/3 peak probability
17-18: 1/3 – 2/3 peak probability
19-20: < 1/3 peak probability
Summary Of Results
This gives the flattest dumbbell shape that I’ve ever seen – though it may not hold that record for long.
I couldn’t help but notice that this curve has inflection points at 6 and 17. There are three results before the first, and three after the second. Those are the parts of the probability chart where probability is rising faster with each successive result – a positive rate of change.
Above these inflecton points, probability increases are getting smaller, until they hit zero at the very broad plateau of results.
That’s prompted me to add a bonus extra alternative, not on the list presented in part 1. Specifically, I wondered about the size of the plateau and the effect on the slope of 2d6+d8 as an alternative.
Just thought I’d mention it!
Extreme results are even less likely than with d8+d12 but the construction will generally roll higher than that particular d20 substitute.
Once past the inflection points, result probability is very even, with just a little drop-off on both sides of the plateau.
The final and most significant observation about this construction is that, relative to d8+d12, and d20, and 3d6, it tends to roll high. Not by much – the average is 0.5 higher than d8+d12 and 1 higher than the other two – but, over multiple rolls, that adds up. These rolls are biased toward success.
But it only takes a -1 modifier for the shoe to be on the other foot. Now, they bias toward failure.
Using +2 and -2 modifiers results in even more extreme examples.
For example:
What’s more, because the likelihood of extreme results is so low, this substitution can me adapted ignoring those results.
2d4+d12+2 may have a maximum of 22 – but 21 and 22 will come up so infrequently that they might as well not be there. At the low end, it’s 5 and 6 that are orphaned – the roll is essentially 7-20 with diminished chances of 7-8 or 19-20.
That gives GMs a lot of latitude to play with.
The other thing that struck me – how could it not? – is how closely the curve of the curving part of the 2d4+d12-2 matches the curve of the 3d6 roll. They are almost identical! Which gives this construction a couple of bonus points as a 3d6 substitute in my opinion.
Finally, you can gild the lily; instead of 2d4, roll 3d4 and keep either the best two or the worst 2.
Sadly, that graph is beyond what AnyDice can analyze, so I’ll have to do it with a spreadsheet. Here’s what I came up with:
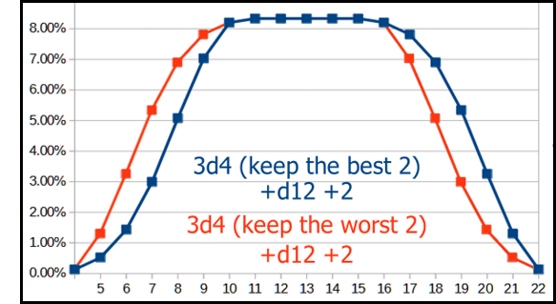
Right away, though the effect is subtle, you can see that the curves are no longer symmetrical. The plateau and results to either side of it are unchanged, but the side described by what you ‘keep’ then follows a more gentle curve for a bit, then parallels the converse at 1 result higher, then declines more steeply at the last to meet up with the final data point of it’s opposite number.
Yes, I know that’s a lot to work through. Take your time and look at each of those descriptive statements, I’m not going anywhere.
(later)
The net effect is of +1 to some of the results, and a shift of the average – to 14.39 if you keep the best two, and to 12.61 if you keep the worst 2. Both should be compared to the roll with straight 2d4, which has an average of 13.5.
/ol>
When To Use This Substitute
This is a combination that’s very sensitive to nuance, as expressed by modifiers. At the same time, it’s relatively forgiving and flat, offering a variety of results about the average. A combination of predictability and randomness, in fact.
I would consider using this combination when that sensitivity is likely to come into play – when decisions or conditions can shade outcomes one way or another.
This would be especially appropriate when one character is actively trying to hamper or support another, instead of doing their own thing. Maneuvering into a position to flank while attacking some other target, or attempting to assist (or distract) from an important use of skill, for example.
You’ve effectively got no less than 27 variations to reflect nuance. Here they are, ranked from most penalizing to most beneficial:
1. 3d4 (keep the worst 2) + d12 – 4:
ave 7.5 – 0.89 = 6.61, min -1, max 16, non-ignorable 1-14
2. 2d4 + d12 -4:
ave 7.5, min -1, max 16, non-ignorable 1-14
3. 3d4 (keep the worst 2) + d12 – 3:
ave 8.5 – 0.89 = 7.61, min 0, max 17, non-ignorable 2-15
4. 3d4 (keep the best 2) + d12 -4:
ave 7.5 + 0.89 = 8.39, min -1, max 16, non-ignorable 1-14
5. 2d4 + d12 -3:
ave 8.5, min 0, max 17, non-ignorable 2-15
6. 3d4 (keep the worst 2) + d12 – 2:
ave 9.5 – 0.89 = 8.61, min 1, max 18, non-ignorable 3-16
7. 3d4 (keep the best 2) + d12 -3:
ave 8.5 + 0.89 = 9.39, min 0, max 17, non-ignorable 2-15
8. 2d4 + d12 -2:
ave 9.5, min 1, max 18, non-ignorable 3-16
9. 3d4 (keep the worst 2) + d12 – 1:
ave 10.5 – 0.89 = 9.61, min 2, max 19, non-ignorable 4-17
10. 3d4 (keep the best 2) + d12 -2:
ave 9.5 + 0.89 = 10.39, min 1, max 18, non-ignorable 3-16
11. 2d4 + d12 -1:
ave 10.5, min 2, max 19, non-ignorable 4-17
12. 3d4 (keep the worst 2) + d12:
ave 11.5 – 0.89 = 10.61, min 3, max 20, non-ignorable 5-18
13. 3d4 (keep the best 2) + d12 -1:
ave 10.5 + 0.89 = 11.39, min 2, max 19, non-ignorable 4-17
14. 2d4 + d12:
ave 11.5, min 3, max 20, non-ignorable 5-18
15. 3d4 (keep the worst 2) + d12 + 1:
ave 12.5 – 0.89 = 11.61, min 4, max 21, non-ignorable 6-19
16. 3d4 (keep the best 2) + d12:
ave 11.5 + 0.89 = 12.39, min 3, max 20, non-ignorable 5-18
17. 2d4 + d12+1:
ave 12.5, min 4, max 21, non-ignorable 6-19
18. 3d4 (keep the worst 2) + d12 + 2:
ave 13.5 – 0.89 = 12.61, min 5, max 22, non-ignorable 7-20
19. 3d4 (keep the best 2) + d12 +1:
ave 12.5 + 0.89 = 13.39, min 4, max 21, non-ignorable 6-19
20. 2d4 + d12 +2:
ave 13.5, min 5, max 22, non-ignorable 7-20
21. 3d4 (keep the worst 2) + d12 + 3:
ave 14.5 – 0.89 = 13.61, min 6, max 23, non-ignorable 8-21
22. 3d4 (keep the best 2) + d12 +2:
ave 13.5 + 0.89 = 14.39, min 5, max 22, non-ignorable 7-20
23. 2d4 + d12 +3:
ave 14.5, min 6, max 23, non-ignorable 8-21
24. 3d4 (keep the worst 2) + d12 + 4:
ave 15.5 – 0.89 = 14.61, min 7, max 24, non-ignorable 9-22
25. 3d4 (keep the best 2) + d12 +3:
ave 14.5 + 0.89 = 15.39, min 6, max 23, non-ignorable 8-21
26. 2d4 + d12 +4:
ave 15.5, min 7, max 24, non-ignorable 9-22
27. 3d4 (keep the best 2) + d12 +4:
ave 15.5 + 0.89 = 16.39, min 7, max 24, non-ignorable 9-22
I’ve numbered them so that they won’t take up as much room on this chart:
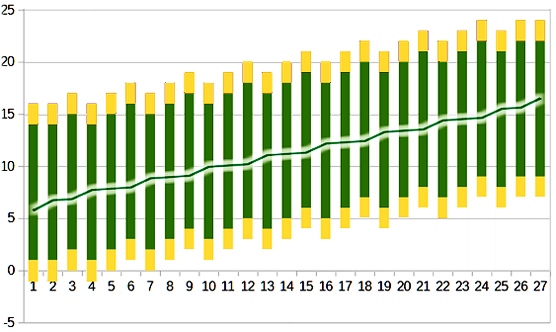
Yellow is ignorable, green is possible or even likely, and the average is shown as a line graph, to scale.
My approach would be to pick the base roll and modifier according to the default average result I thought appropriate, locate it on the list, and proceed up or down the list from there as seemed appropriate.
And that’s where this part has to come to an end. Next week, part 2 (if all goes according to plan)!

Discover more from Campaign Mastery
Subscribe to get the latest posts sent to your email.


October 28th, 2025 at 12:00 am
[…] and the second one diminishes it. We’ve seen that before, with the 2d4+d12 curve (from part 1) – but that had inflection points on successive results, so they were even less […]